Bitcoin, Ether, Major Altcoins – Weekly Market Update March 1, 2021

The total crypto market cap erased $201 billion from its value for the last seven-days and now stands at $1,465 billion. The top 10 coins were mostly in red for the same time period with only Cardano (ADA) adding 15 percent. At the same time, Litecoin (LTC) decreased by 25.1 percent. By the time of writing bitcoin (BTC) is trading at $47,823, ether (ETH) is at $1,525.

BTC/USD

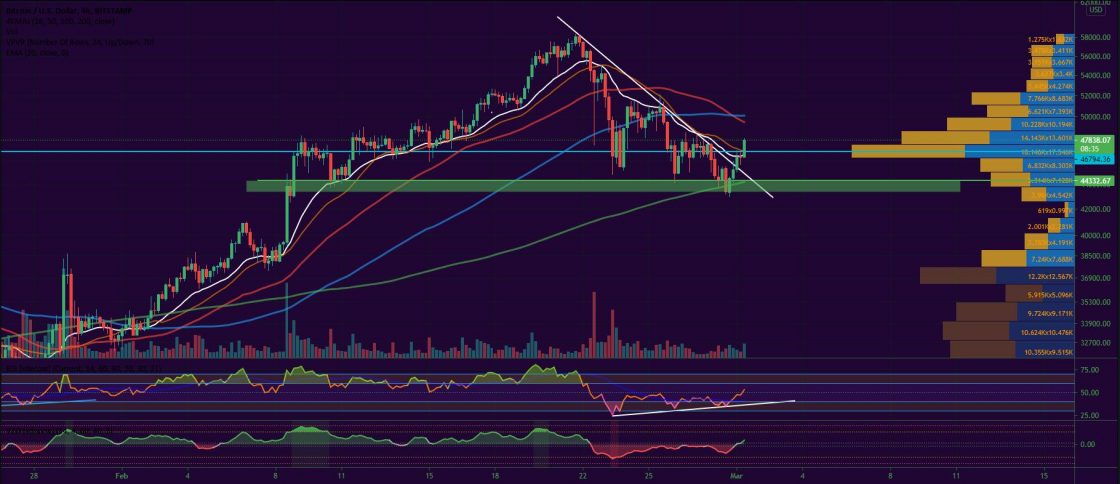
Bitcoin reached its highest point ever – $58,452 during intraday trading on Sunday, February 21 then fell back down to $57,489 later in the evening to conclude the seven-day period. The rapid increase in the price of BTC resulted in another 19 percent being added to its market capitalization for the week.

The coin seemed to be losing its momentum and was already in an overbought zone according to the major trend strength indicators. What is more, the market was overheated and Tesla’s CEO Elon Musk also noted that, pointing out that the price of both bitcoin and ether was way too high already. His tweets triggered a massive selloff across the major altcoins.

The BTC/USD pair crash to $47,344 was one of the biggest in its history. The coin lost $10,125 in just a few hours’ time. The majority of the veteran traders were quick enough to “buy the dip”, which facilitated the recovery in the second part of the day session. Still, BTC continued trading 5.7 percent lower by closing at $54,178.

The increased pressure from sellers, however, caused another collapse on Tuesday, February 23, this time to $44,482 as BTC hit its 26-day EMA on the daily chart and almost reached its next supply zone situated in the area between $44,000 and $43,000. Once again bulls pushed the price up a little bit in the aftermath of the plunge, but BTC registered a second-straight day on negative territory. It was already trading 16 percent lower compared to the Sunday peak.

The mid-week session on Wednesday was when the coin initiated a comeback. It was trading in the wide range between $51,605 and $47,000 before stopping at $49,801.

On Thursday, February 25, the coin managed to surpass the 100-day EMA on the lower 4-h timeframe and reached a daily high of $52,000. This level, however, proofed to be a solid resistance, and bulls were immediately rejected there which resulted in a heavy correction down to $47,070.

The Friday session was no different and BTC faced additional resistance at the $47,500-$48,000 zone, which was already famous for its stability from early February. It is also where the highest volume pressure was concentrated (visible on the VPVR indicator on our chart as well). The BTC/USD pair closed at $46,300, slightly up from the daily low of $44,180.

The weekend trading was a continuation of the freefall as the entire cryptocurrency market was very close to entering a bear market. First, on Saturday, bitcoin fell below the 26-day EMA, which is usually an indicator of a mid-term trend reversal. Then on Sunday, it descended $45,267 closing the month with a 37 percent of a price increase.

The biggest cryptocurrency is currently trading at $47,823 and above the short-term diagonal resistance after a bullish divergence on the lower timeframes triggers a reversal to the upside.

4-hour chart:

ETH/USD

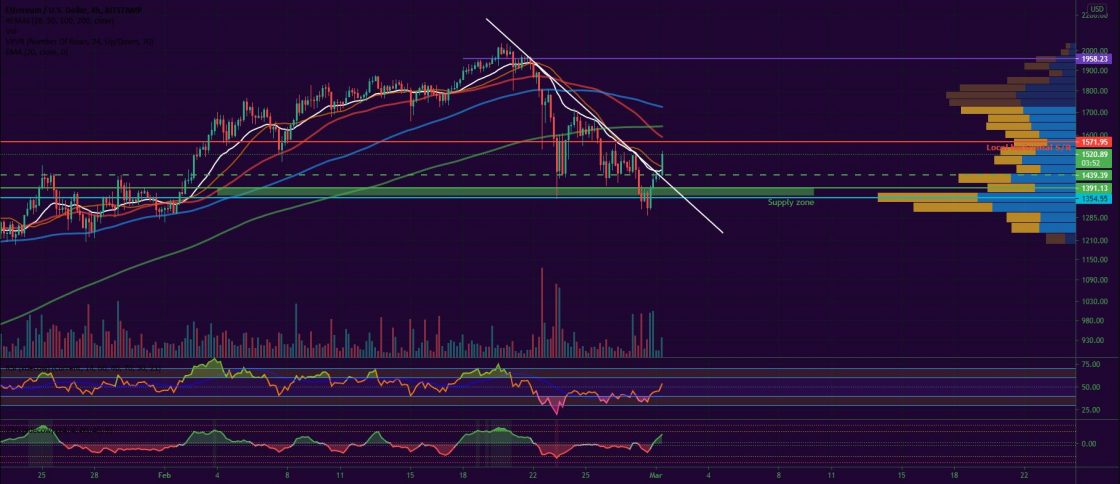
The Ethereum Project token ETH peaked at $1,978 on Sunday but was unable to print a new high most probably as a direct result of the already exhausted short-term uptrend. The leading altcoin closed the day and the week in green but was not in a position to consolidate in the area mainly due to the lack of high incoming trading volumes.

On Monday, it followed the example of BTC and the rest of the major altcoin and registered a double-digit loss by nosediving to $1,542. It partially recovered by climbing back up to $1,777 at the daily close, but the overall market sentiment was turning bearish.

The Tuesday session was no different and the ether erased another 11 percent of its value. It is worth noting that the ETH/USD pair was trading at $1,351, or right below the short-term EMAs during intraday.

The third day of the workweek was a good one for buyers. The price of ether was moving up and down between the 26 and 50-day EMAs before closing with a short green candle to $1,630 on the daily chart.

On Thursday, February 25, the coin was mainly gravitating around the 200-day EMA on the 4-hour chart before falling further to $1,480 in the evening. Naturally, bulls were turning to $1,440 as the next level of support, which already survived once February 23 and was an extremely stable resistance back in late January when ETH was struggling to break above the horizontal wall.

The Friday session saw it trading in the $1,400 – $1,560 area before closing with a short red candle to $1,445.

The weekend of February 27-28 started with a short bounce above the 26-day EMA on Saturday and a heavy drop to $1,290 on Sunday (later corrected to $1,424 at the daily close) right on time for the monthly candle close. The ETH token closed on February 8 percent up.

The ETH/USD pair is trading significantly higher, at $1,522 as of the time of writing. 4-hour chart

Leading Majors

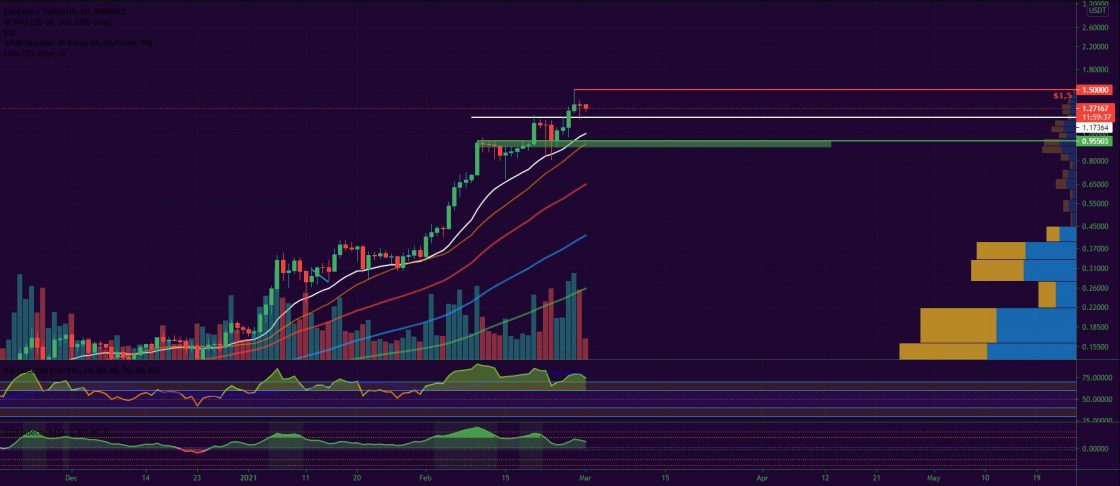
Ethereum’s main competitor was the sole cryptocurrency on CoinGecko’s Top 10, which closed the previous seven-day period in green. The ADA/USDT pair grew by 18 percent for the week becoming the third-largest digital asset with a market capitalization of approximately $40 billion. The coin peaked at $1,49 on Saturday, February 28 as a result of the coin accumulation prior to the upcoming Mary mainnet launch scheduled for March 1.

The next major support level for ADA is the previous horizontal resistance at $1.16 with $1.5 as the big target in front of bulls.

Altcoin of the Week

Our altcoin of the week is Polygon (MATIC). The so-called “Internet for blockchains” reached #65 with a total market capitalization of approximately $1.1 billion.

The coin increased by 43 percent on a weekly basis and is 451 percent up for the last month.

The MATIC/USDT pair peaked at $0.234 on Saturday, February 27 on the news that the major gaming company Atari is working to integrate Polygon for use of their NFT and token products.

As of the time of writing, MATIC is trading at $0.228:


Like BTCMANAGER? Send us a tip!

Our Bitcoin Address: 3AbQrAyRsdM5NX5BQh8qWYePEpGjCYLCy4


Original

Spread the love

Related posts

Leave a Comment

Bitcoin, Ether, Major Altcoins – Weekly Market Update March 1, 2021

The total crypto market cap erased $201 billion from its value for the last seven-days and now stands at $1,465 billion. The top 10 coins were mostly in red for the same time period with only Cardano (ADA) adding 15 percent. At the same time, Litecoin (LTC) decreased by 25.1 percent. By the time of writing bitcoin (BTC) is trading at $47,823, ether (ETH) is at $1,525.

BTC/USD

Bitcoin reached its highest point ever – $58,452 during intraday trading on Sunday, February 21 then fell back down to $57,489 later in the evening to conclude the seven-day period. The rapid increase in the price of BTC resulted in another 19 percent being added to its market capitalization for the week.

The coin seemed to be losing its momentum and was already in an overbought zone according to the major trend strength indicators. What is more, the market was overheated and Tesla’s CEO Elon Musk also noted that, pointing out that the price of both bitcoin and ether was way too high already. His tweets triggered a massive selloff across the major altcoins.

The BTC/USD pair crash to $47,344 was one of the biggest in its history. The coin lost $10,125 in just a few hours’ time. The majority of the veteran traders were quick enough to “buy the dip”, which facilitated the recovery in the second part of the day session. Still, BTC continued trading 5.7 percent lower by closing at $54,178.

The increased pressure from sellers, however, caused another collapse on Tuesday, February 23, this time to $44,482 as BTC hit its 26-day EMA on the daily chart and almost reached its next supply zone situated in the area between $44,000 and $43,000. Once again bulls pushed the price up a little bit in the aftermath of the plunge, but BTC registered a second-straight day on negative territory. It was already trading 16 percent lower compared to the Sunday peak.

The mid-week session on Wednesday was when the coin initiated a comeback. It was trading in the wide range between $51,605 and $47,000 before stopping at $49,801.

On Thursday, February 25, the coin managed to surpass the 100-day EMA on the lower 4-h timeframe and reached a daily high of $52,000. This level, however, proofed to be a solid resistance, and bulls were immediately rejected there which resulted in a heavy correction down to $47,070.

The Friday session was no different and BTC faced additional resistance at the $47,500-$48,000 zone, which was already famous for its stability from early February. It is also where the highest volume pressure was concentrated (visible on the VPVR indicator on our chart as well). The BTC/USD pair closed at $46,300, slightly up from the daily low of $44,180.

The weekend trading was a continuation of the freefall as the entire cryptocurrency market was very close to entering a bear market. First, on Saturday, bitcoin fell below the 26-day EMA, which is usually an indicator of a mid-term trend reversal. Then on Sunday, it descended $45,267 closing the month with a 37 percent of a price increase.

The biggest cryptocurrency is currently trading at $47,823 and above the short-term diagonal resistance after a bullish divergence on the lower timeframes triggers a reversal to the upside.

4-hour chart:

ETH/USD

The Ethereum Project token ETH peaked at $1,978 on Sunday but was unable to print a new high most probably as a direct result of the already exhausted short-term uptrend. The leading altcoin closed the day and the week in green but was not in a position to consolidate in the area mainly due to the lack of high incoming trading volumes.

On Monday, it followed the example of BTC and the rest of the major altcoin and registered a double-digit loss by nosediving to $1,542. It partially recovered by climbing back up to $1,777 at the daily close, but the overall market sentiment was turning bearish.

The Tuesday session was no different and the ether erased another 11 percent of its value. It is worth noting that the ETH/USD pair was trading at $1,351, or right below the short-term EMAs during intraday.

The third day of the workweek was a good one for buyers. The price of ether was moving up and down between the 26 and 50-day EMAs before closing with a short green candle to $1,630 on the daily chart.

On Thursday, February 25, the coin was mainly gravitating around the 200-day EMA on the 4-hour chart before falling further to $1,480 in the evening. Naturally, bulls were turning to $1,440 as the next level of support, which already survived once February 23 and was an extremely stable resistance back in late January when ETH was struggling to break above the horizontal wall.

The Friday session saw it trading in the $1,400 – $1,560 area before closing with a short red candle to $1,445.

The weekend of February 27-28 started with a short bounce above the 26-day EMA on Saturday and a heavy drop to $1,290 on Sunday (later corrected to $1,424 at the daily close) right on time for the monthly candle close. The ETH token closed on February 8 percent up.

The ETH/USD pair is trading significantly higher, at $1,522 as of the time of writing. 4-hour chart

Leading Majors

Ethereum’s main competitor was the sole cryptocurrency on CoinGecko’s Top 10, which closed the previous seven-day period in green. The ADA/USDT pair grew by 18 percent for the week becoming the third-largest digital asset with a market capitalization of approximately $40 billion. The coin peaked at $1,49 on Saturday, February 28 as a result of the coin accumulation prior to the upcoming Mary mainnet launch scheduled for March 1.

The next major support level for ADA is the previous horizontal resistance at $1.16 with $1.5 as the big target in front of bulls.

Altcoin of the Week

Our altcoin of the week is Polygon (MATIC). The so-called “Internet for blockchains” reached #65 with a total market capitalization of approximately $1.1 billion.

The coin increased by 43 percent on a weekly basis and is 451 percent up for the last month.

The MATIC/USDT pair peaked at $0.234 on Saturday, February 27 on the news that the major gaming company Atari is working to integrate Polygon for use of their NFT and token products.

As of the time of writing, MATIC is trading at $0.228:


Like BTCMANAGER? Send us a tip!

Our Bitcoin Address: 3AbQrAyRsdM5NX5BQh8qWYePEpGjCYLCy4


Original

Spread the love

Related posts

Leave a Comment