The total crypto market cap added $168 billion to its value for the last seven-days and now stands at $2,106 billion. The top 10 coins were mostly in green for the same time period with Polkadot (DOT) being the only exception with its 7.1 percent of price decrease. Bitcoin (BTC) is currently trading at $60,739, ether (ETH) is at $2,177.
BTC/USD
Bitcoin failed to break it’s all-time high last week and after multiple rejections near the $60,000 area, was pushed back down below the weekly resistance zone. The coin closed the previous seven-day period at $58,220, successfully rebounding from the 21-day EMA on the daily timeframe on Sunday, April 4. The move resulted in a 4.4 percent increase for the week.
The trading day on Monday was quite volatile and we saw the biggest cryptocurrency once again touching the shortest EMA on our chart at $56,800 before forming a solid green candle to $59,140 in the evening.
It is worth noting that the price was fluctuating in the $59,000 – $55,800 range since March 15 with the only exception being the four-day period between 23-27 March.
On Tuesday, April 6 bulls were once again left empty handed, suffering yet another rejection at the $59,000 mark, which triggered a pullback to $57,200 during intraday, and eventually a daily candle close at the weekly open level – $58,100.
The mid-week session on Wednesday was a continuation of the short-term downtrend reversal as BTC continued to slide, reaching the lower boundary of the above-mentioned range. It erased 5.2 percent of its value for the two days of correction.
On Thursday, the BTC/USDT pair started moving up again. It formed a solid green candle to $58,170, adding 4 percent. As mentioned during our previous analysis, re-capturing the 21-day EMA at $56,600 was a prerequisite and a potential trigger point for adding new long positions. Once this was completed, buyers slowly started taking over control.
BTC remained flat on Friday then surpassed the weekly open on Saturday by reaching $61,237 during intraday. Also temporarily breaking above the weekly resistance zone. It ended the day at $59,800.
The Sunday session was no different and bitcoin continued to march North. This time to $59,971 registering a 3 percent increase on a weekly basis.
What we are seeing on Monday morning is increased bull pressure in front of the horizontal line formed around the last highest daily candle close.
ETH/USD
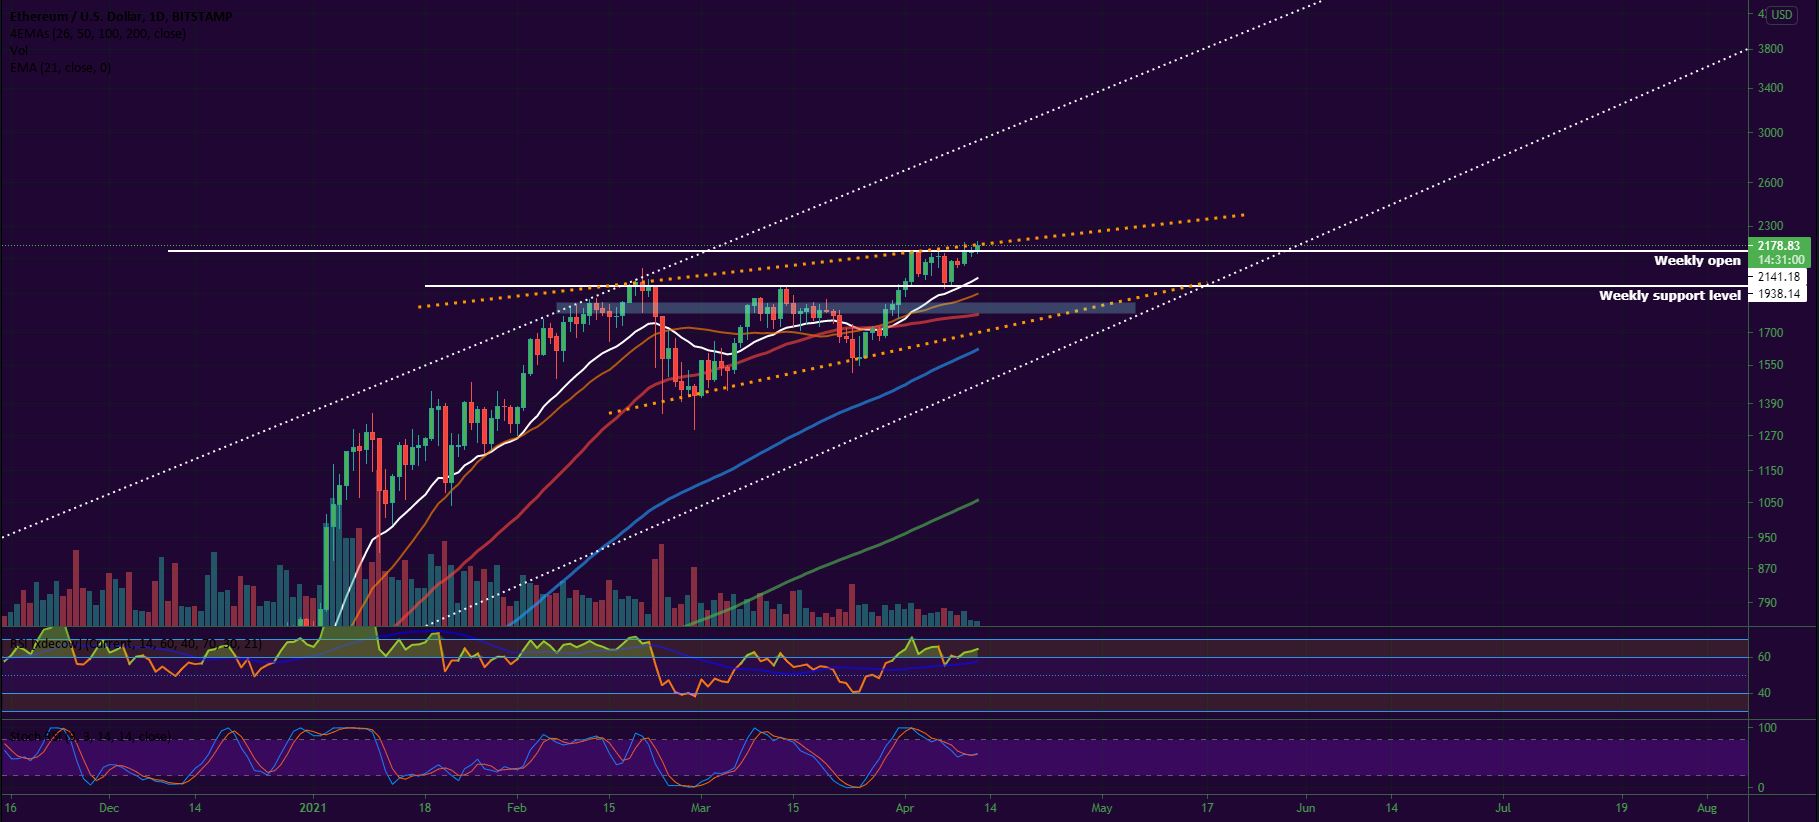
The Ethereum Project token ETH hit a new all-time high last week, touching $2,146 on April 2 and managed to keep most of the gains before the weekly candle close on Sunday, which helped it add the stunning 23 percent to its valuation.
On Monday, April 5 and Tuesday, April 6, the ETH/USD pair continued to move North and printed yet another highest point of trading – $2,153. The rally, however, looked exhausted as profit-taking activities started to kick in.
On the third day of the workweek, the ether dropped all the way down to $1,927 in early hours of trading before stabilizing above the previously solid weekly resistance level near $1,943 turning it into support. The uptrend remained intact and even though the coin lost 7 percent, the bullish market structure was not broken.
Just like bitcoin, the ETH/USDT pair rebounded from the support and started making its way back up on Thursday. It grew by 5.8 percent and reached the weekly open at $2,072.
The last day of the workweek came with a consolidation around the mentioned level – preparation for an uptrend continuation, based on the uptrend channels formed on daily/weekly timeframes.
The weekend of April 10-11 started with a fresh all-time high on Saturday. The Ethereum token hit $2,199, right above the upper boundary of the trend corridor.
On Sunday, buyers only managed to ensure a stable closure at $2,153 as the biggest altcoin finished the week 3.7 percent higher.
It is trading slightly higher – at $2,176 on Monday morning, flirting with the diagonal resistance line.
Top 10 Movers
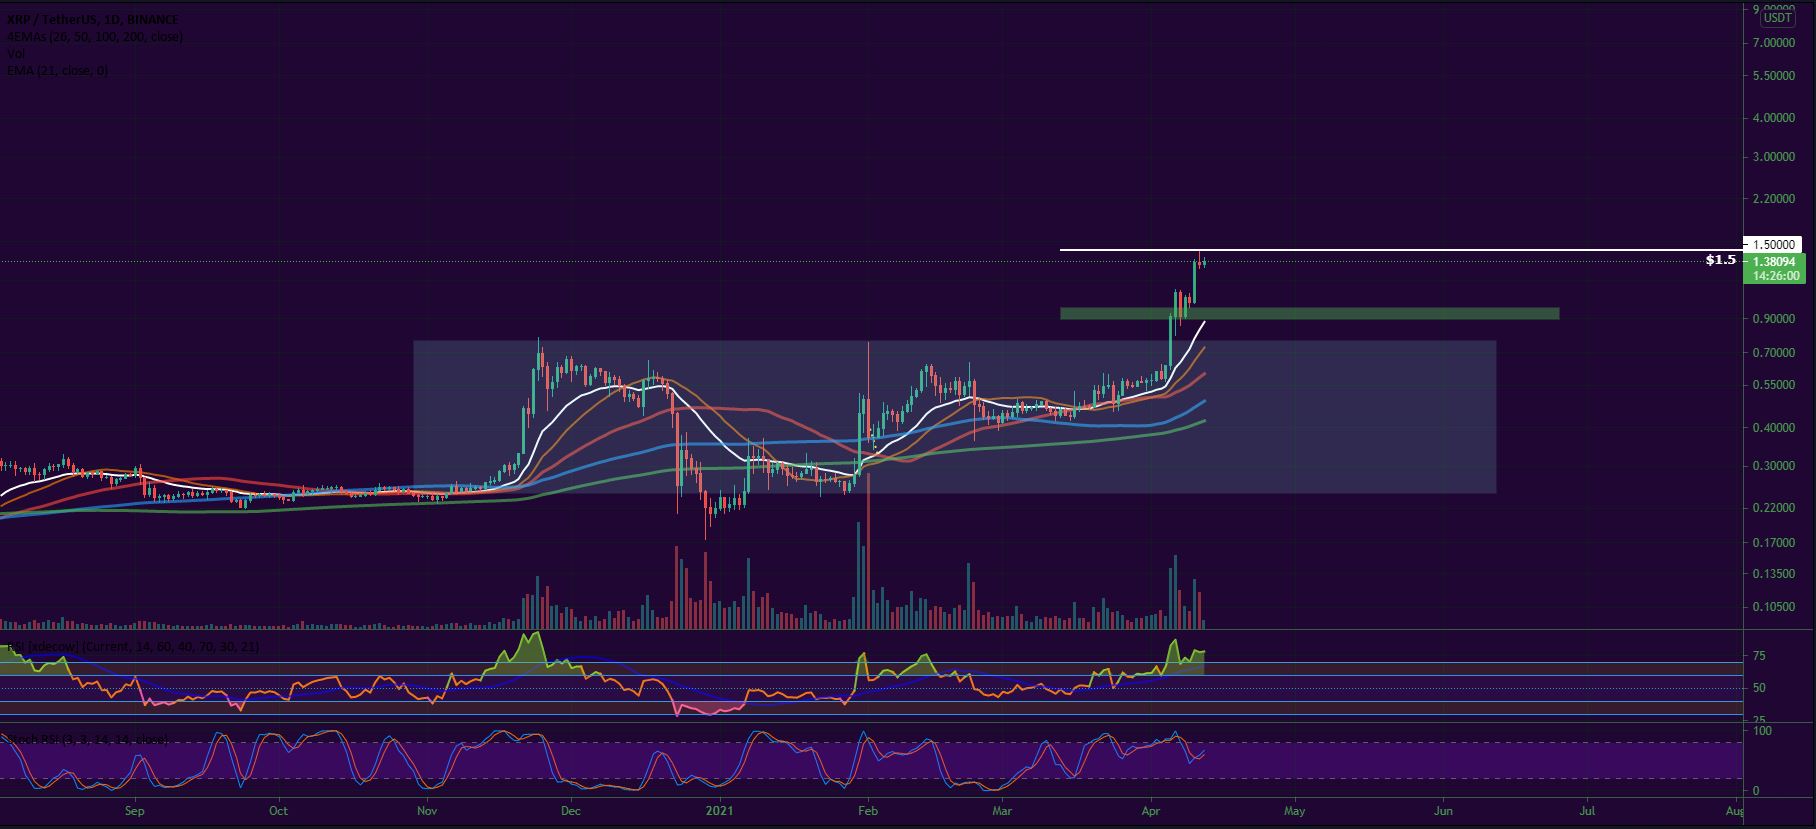
The rise of XRP is once again front-page news. The Ripple company token was the best performing digital asset in the Top 10 list for the past week and it managed to increase by 113 percent for the period.
The coin climbed above $1.00 for the first time since April 2018 hitting the $1.50 mark on Sunday, April 11. What is more, it is now worth five times as much as it was on January 1 this year.
Bulls were successful in breaking out of the $0.65-$0.7 zone, which marked the upper limit of the range, and will be now looking to defend the recent gains, mainly by consolidating in the $1.10 area. This level will act as our next line of support.
Naturally, the next critical level to re-capture will be $1.5 (the coin is currently trading at $1.38). A significant pullback could be expected given the rapid price increase in the last week or so.
Altcoin of the Week
Our Altcoin of the week is Bitcoin Gold (BTG). One of the popular Bitcoin forks added 176 percent to its value for the last seven days and moved above the $100 mark for the first time since February 2018. The coin is 1187 percent up since the beginning of 2021, which makes it one of the best performing “legacy” projects in the Top 100 list.
The most probable reason for the surge is the revived interest towards legacy cryptocurrency projects like XRP, LTC and BCH. Additionally, Bitcoin Gold announced a partnership with Phala Network to “develop and deploy a lightweight, secure bridge between BTG and the Polkadot ecosystem using Phala’s private and secure TEEs.”
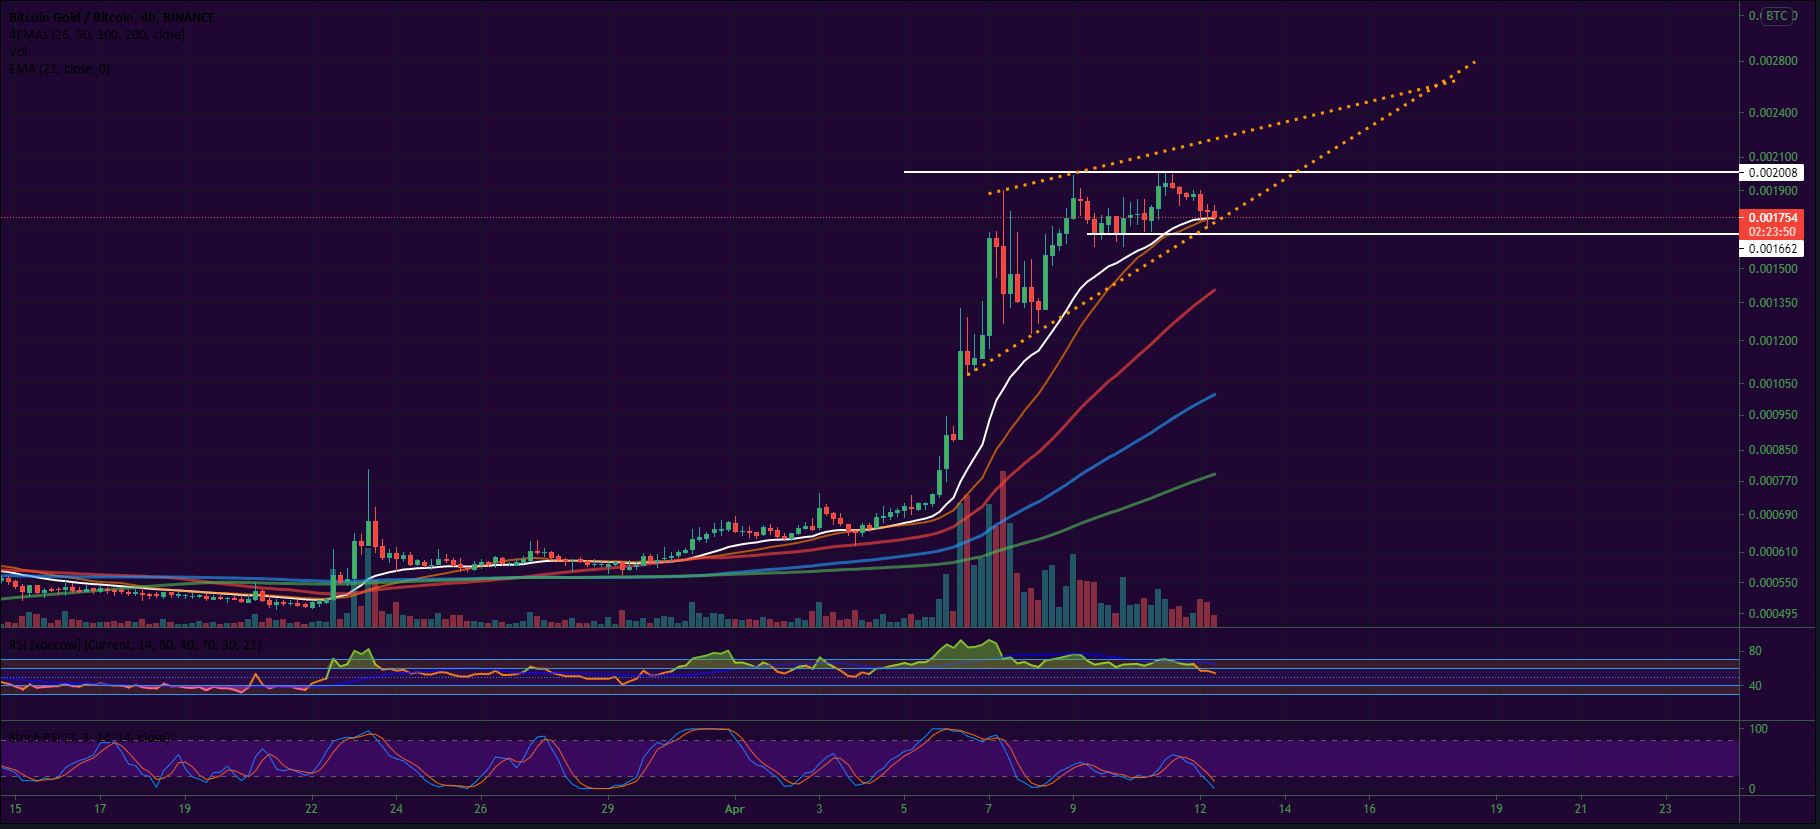
The BTG token peaked at 0.00203 (around $116.8) against BTC on Sunday, April 11. It reached #66 on the CoinGecko’s Top 100 list with a total market cap of approximately $1.9 billion.
As of the time of writing this market update, BTG is trading at 0.00176 against BTC on Binance:
Like BTCMANAGER? Send us a tip!
Our Bitcoin Address: 3AbQrAyRsdM5NX5BQh8qWYePEpGjCYLCy4


