The Bitcoin market came back on its bullish track during the February 18’s trading session.
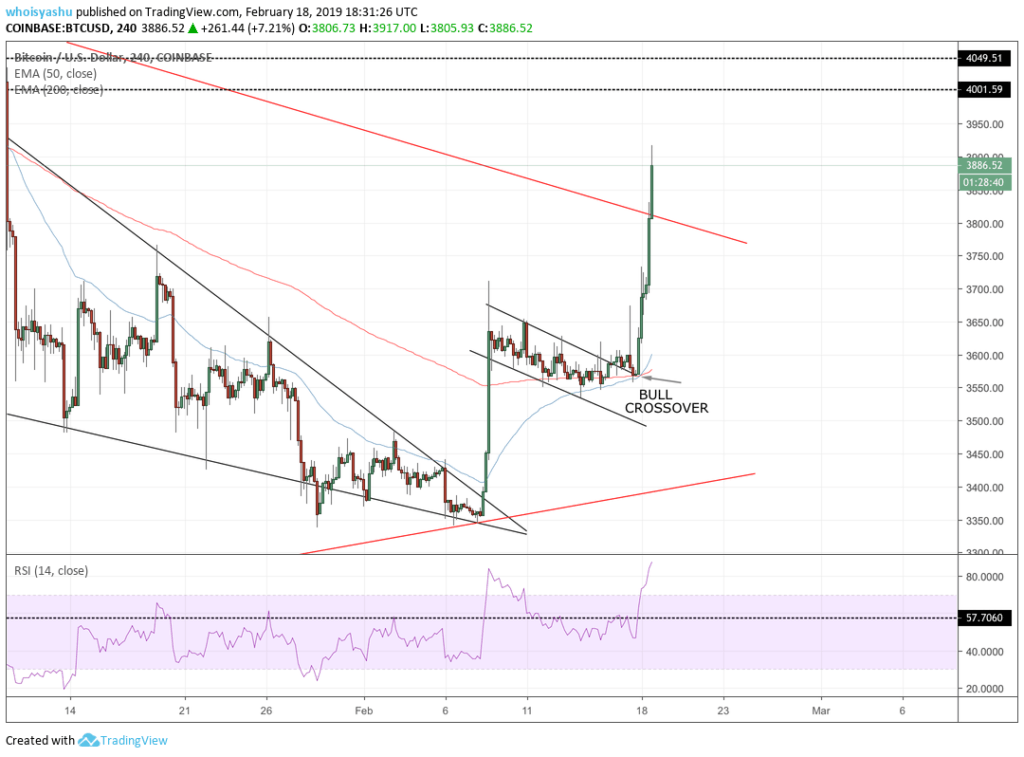
The Bitcoin-to-Dollar rate (BTC/USD) on Monday established an intraday high towards 3917, up 8.08% since the open. The pair rallied through the Asian session and continued its upside momentum after the European market opened. Around 1600 UTC, BTC/USD also broke through a strong resistance trendline of the medium-term triangle pattern discussed in our Bart Simpson analysis. Have a look:
Last week, we had left the Bitcoin market in a bias conflict. The cryptocurrency was forming what looked like a bull flag. Nevertheless, as the flag was generated out of a one-day rally of February 8, we were unsure about its sustainability in the near-term.
But today, the upside breakout from the small descending channel (in the chart above) confirmed an interim bullish bias. As discussed, we opened a long position towards the red line above (the same strong resistance trendline) and were able to squeeze out a decent profit off our intraday trade.
False Breakout Area?
Technically, Bitcoin is in a strong position. Today, we witnessed a bullish crossover action. Such a move is confirmed when a near-term moving average crosses above a long-term moving average. In the chart above, one can notice how the 50-period EMA jumped above the 200-period EMA exactly when bitcoin posted a $100-long green candle.
After breaking above the red trendline, bitcoin has now entered what we call a false breakout area. That being said, the cryptocurrency can still return inside the triangle pattern area defined between the two red trendlines. Bitcoin would, first, need to establish new interim support to pursue the next upside action to confirm a strong bias. And after that, we believe jumping above $4,000 would confirm a stronger uptrend.
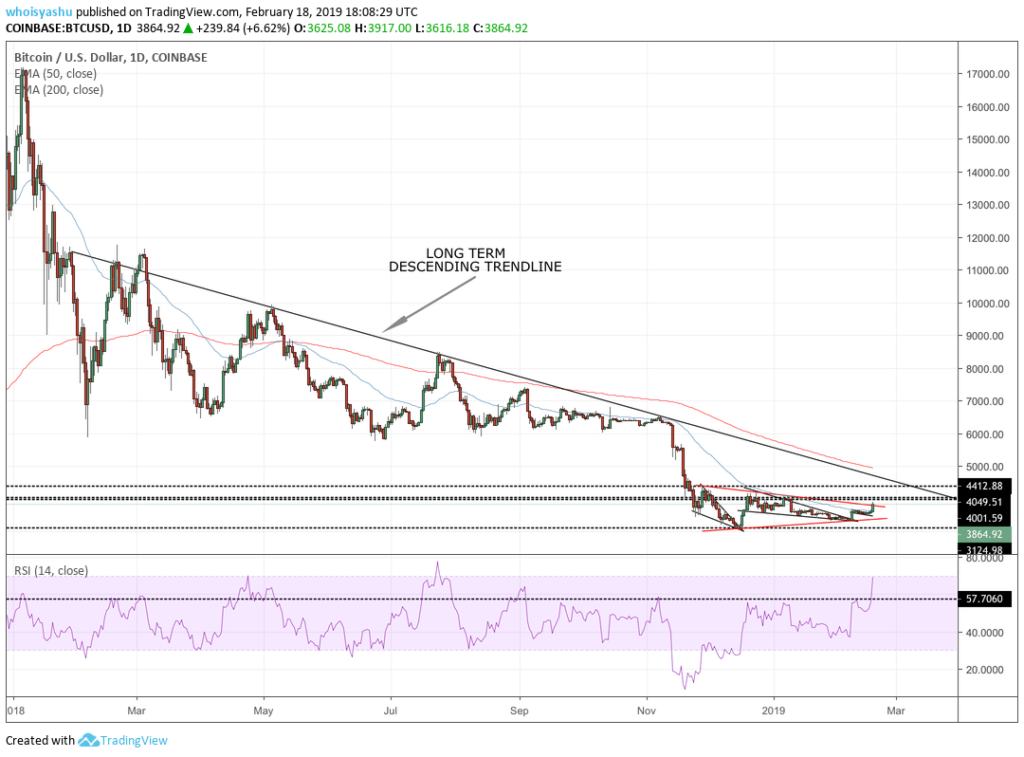
Bitcoin 1D Chart
In a long-term scenario, bitcoin uptrend finds itself capped by a giant descending trendline. As long as we see bitcoin under the broad line, we cannot establish a full-fledged bullish bias. On a positive note, the daily RSI has crossed above 57.7 for the first time since September 23. It is positively signaling a bullish momentum in the medium-term scenario.
Bitcoin Intraday Targets
For long trades:
- We enter long towards $4,000.
- At the same time, we maintain a stop loss order 1-pip below the entry point.
For short trades:
- We wait for the sign of trend reversal (selling action coupled with a rise in volume)
- We enter short towards 4H 50-period moving average.
- We maintain a stop loss order 1-pip above the entry point.
Trade safe!
Click here for a real-time bitcoin price chart.
Featured Image from Shutterstock. Price Charts from TradingView.


