View
- Bitcoin appears on track to snap its six-month losing streak and close February in the green for the fifth consecutive year. A 10 percent gain is accompanied by signs of bearish exhaustion on the weekly chart. As a result, BTC may remain bid in March.
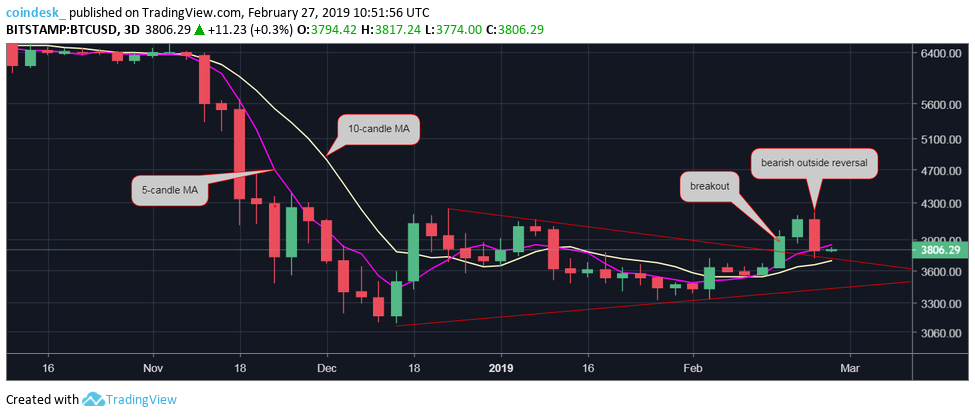
- The short-term outlook remains bullish, with BTC holding above $3,714 and the 5- and 10-candle moving averages on the 3-day chart trending north. Further, a triangle breakout, witnessed last week, is still valid. A strong bounce from the 10-candle MA at $3,693 could yield a move toward $4,000.
- A UTC close below $3,714 would validate the bearish outside reversal candle seen in the three-day chart and open the doors to levels below $3,400.
- The outlook as per the monthly chart remains bearish, as moving average studies are still trending south. The bearish setup would be invalidated if and when prices clear the resistance of the trendline falling from December 2017 highs, currently at $5,000.
Bitcoin (BTC) looks set to end its record six-month losing streak with modest gains in February.
The crypto market leader is currently trading at $3,800 on Bitstamp, representing a 10 percent gain on the monthly opening price of $3,434, according to CoinDesk Bitcoin Price Index (BPI). Had BTC remained bid at highs above $4,100 seen over the weekend, the monthly gain would have been close to 20 percent.
Nevertheless, a 10 percent rise – assuming prices stay at $3,800 till UTC close tomorrow – will be the first positive monthly performance since July.
Prices dropped 9, 6, 4.4, 37, 7 and 7.5 percent, respectively, in the previous six months, the longest stretch of monthly losses on record. Notably, November’s double-digit drop did the most damage, as prices tumbled below the long-held support of $6,000, dashing hopes of a long-term bullish reversal from that level.
The sell-off, however, ran out of steam near $3,300 in the last two months, allowing BTC to post a notable bounce in a seasonally positive month of February.
More importantly, as we enter the final month of the first quarter, signs of bearish exhaustion have emerged on longer duration charts, as discussed earlier this week. BTC, therefore, could remain better bid in March – a weak month for the leading cryptocurrency since 2014.
Monthly chart
A green candle has appeared on the monthly chart after six months. The path of least resistance, however, is still to the downside, as indicated by the downward sloping 5- and 10-month moving averages (MAs).
A break above the descending trendline connecting the December 2017 and November 2018 highs is needed to invalidate the bearish view.
Weekly chart
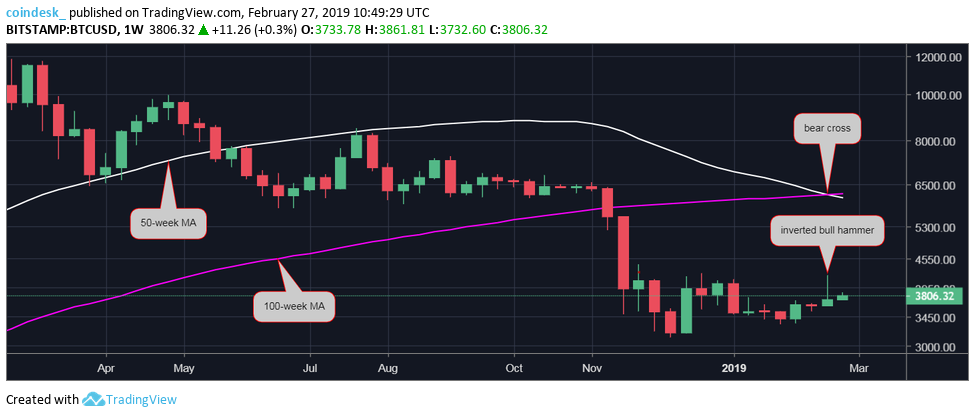
On the above chart, the 50-week MA has dropped below the 100-week MA for the first time since early 2015. That long-term bearish crossover is widely considered a lagging indicator. Further, historical data shows the previous bear market ended with the bear cross of the two averages.
Further, the cryptocurrency created an inverted bullish hammer last week, validating the argument seller exhaustion signaled by the long-term MA crossover.
BTC, therefore, may remain on the offensive next month.
3-day chart
BTC created a bearish outside reversal (engulfing) candle yesterday, countering the bullish outside reversal created in three days to Feb. 8. A bullish-to-bearish reversal, however, would be confirmed only if BTC finds acceptance under $3,714.
That looks unlikely, as the 10-candle MA, currently placed just below $3,700, is trending north and could recharge engines for a re-test of $4,000.
Bitcoin image via CoinDesk archives; charts by Trading View


