Altcoins are selling off ahead of this week’s Bitcoin ETF launch, perhaps a sign that traders are anxious about this historic listing.
ProShares Bitcoin Strategy ETF will enter the history books on Oct. 19 when it starts trading on the New York Stock Exchange under the ticker BITO.
Market participants are likely to watch the volumes on the ETF closely to gauge the amount of participation from institutional investors. If the response is tepid for a few days, short-term traders may be tempted to book profits, but the bullish momentum may pick up further if demand remains strong.
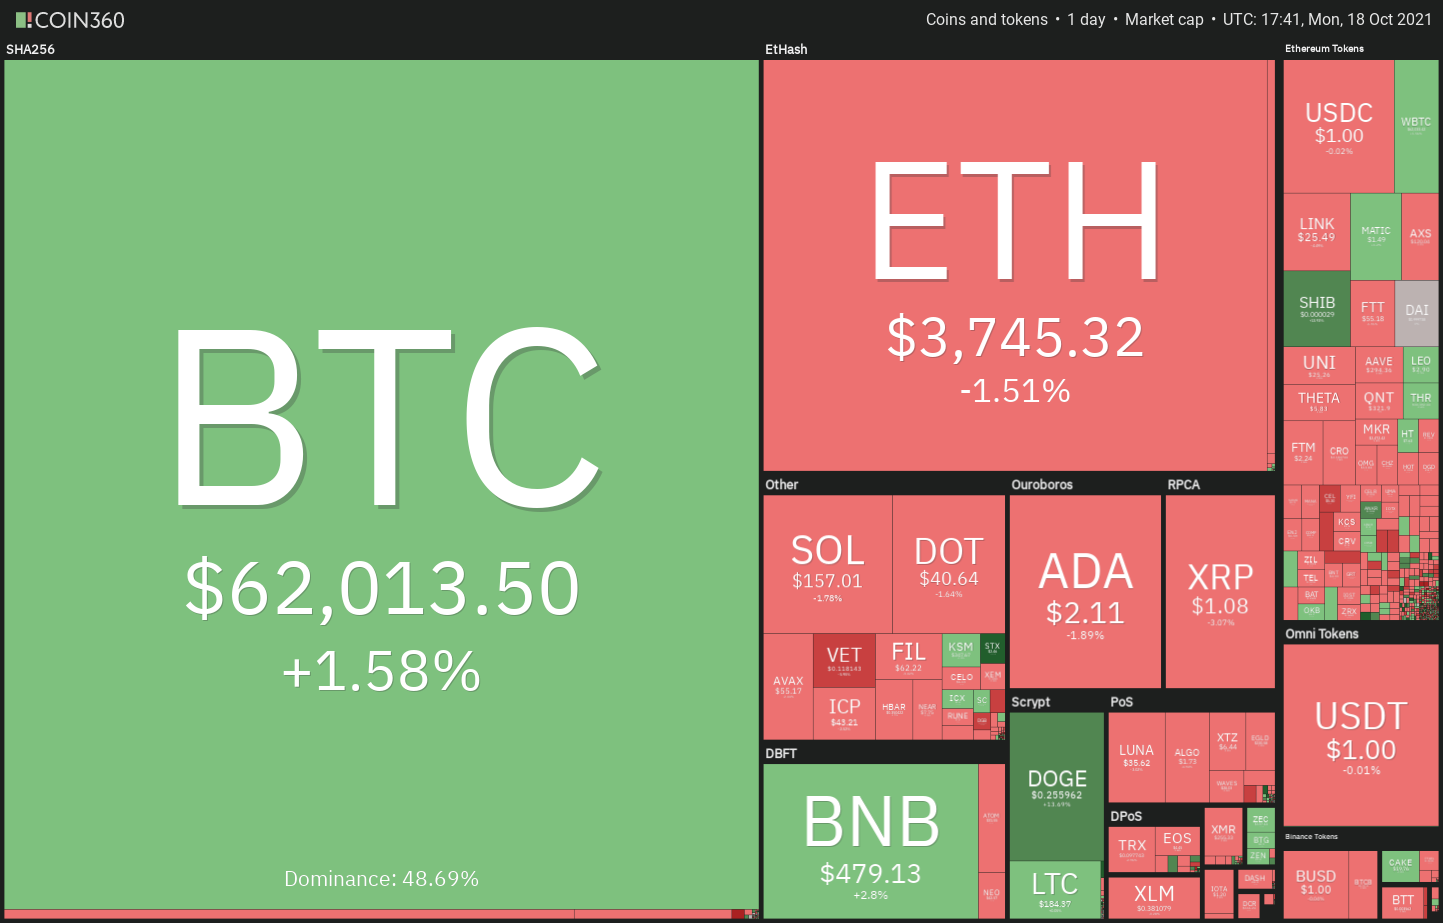
The latest CoinShares report for the week ending Oct. 17 shows that institutional inflows into crypto products has pushed the total assets held by institutional managers to a new record high of $72.3 billion. Of the total inflow of $80 million during the week, Bitcoin products attracted the lion’s share at $70 million.
Could the launch of a new ETF boost sentiment and push Bitcoin to a new all-time high or will short-term traders book profits? Is it time for money to flow out of Bitcoin and into altcoins? Let’s study the charts of the top-10 cryptocurrencies to find out.
BTC/USDT
The long tail on Bitcoin’s Oct. 17 candlestick shows strong buying on dips. The bulls attempted to push the price above the Oct. 15 high at $62,933 today but failed. This suggests that bears are defending the zone between $62,933 and $64,854 with vigor.
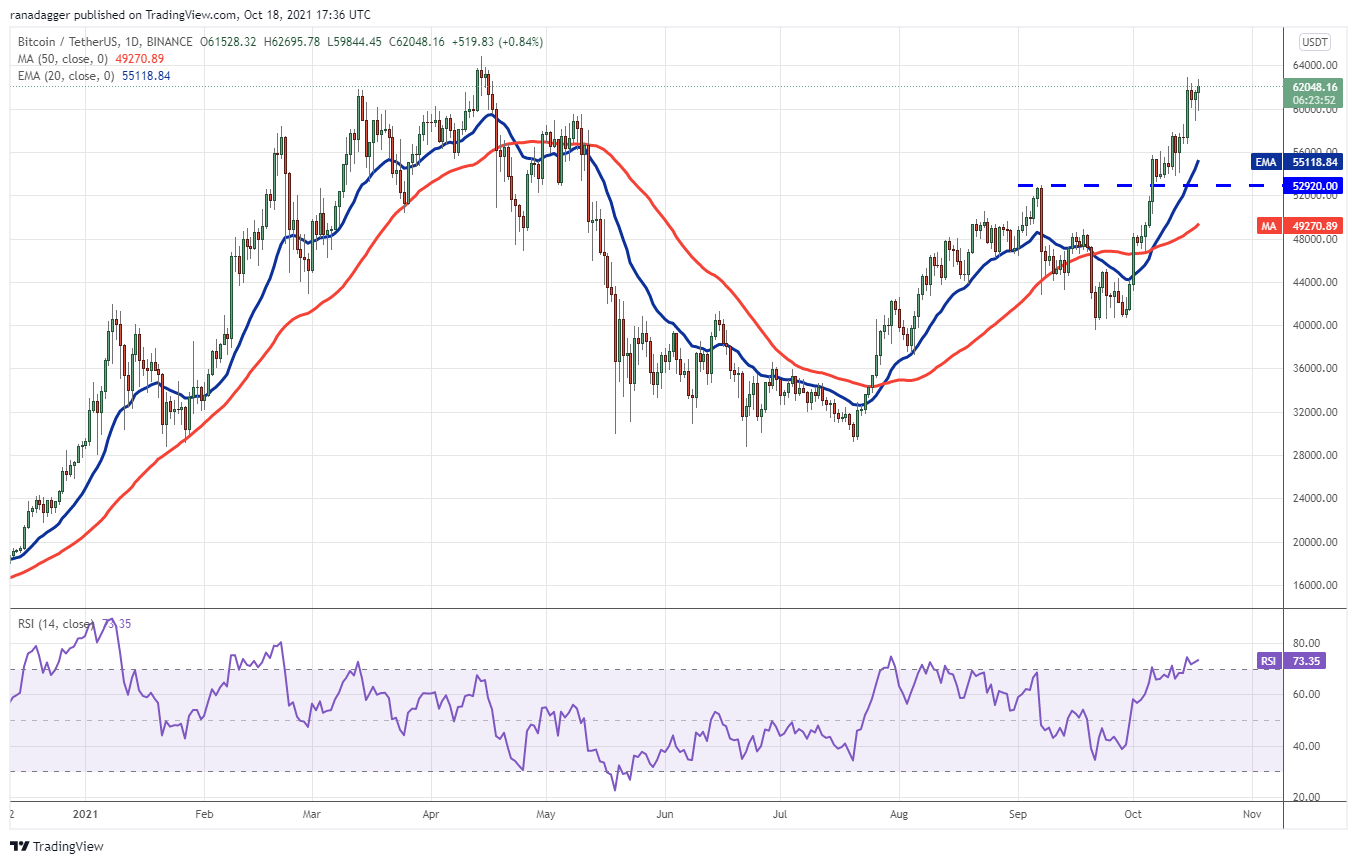
If sellers sink the price below $58,963, the BTC/USDT pair could drop to the 20-week exponential moving average ($55,118). A strong rebound off this support will indicate that sentiment remains positive and traders are buying on dips.
The bulls will then make one more attempt to clear the overhead obstacle. If they succeed, the pair could start the next leg of the uptrend that could reach $70,000 and then $75,000.
If the 20-day EMA support is breached, the pair could drop to the breakout level at $52,920. This is an important support to keep an eye on because if it cracks, the pair may plummet to the 50-day simple moving average ($49,270).
ETH/USDT
The bulls successfully defended the neckline of the inverse head and shoulders (H&S) pattern on Oct. 17 but they could not sustain the rebound. This suggests that demand dries up at higher levels. The bears have again pulled Ether (ETH) to the neckline of the setup today.
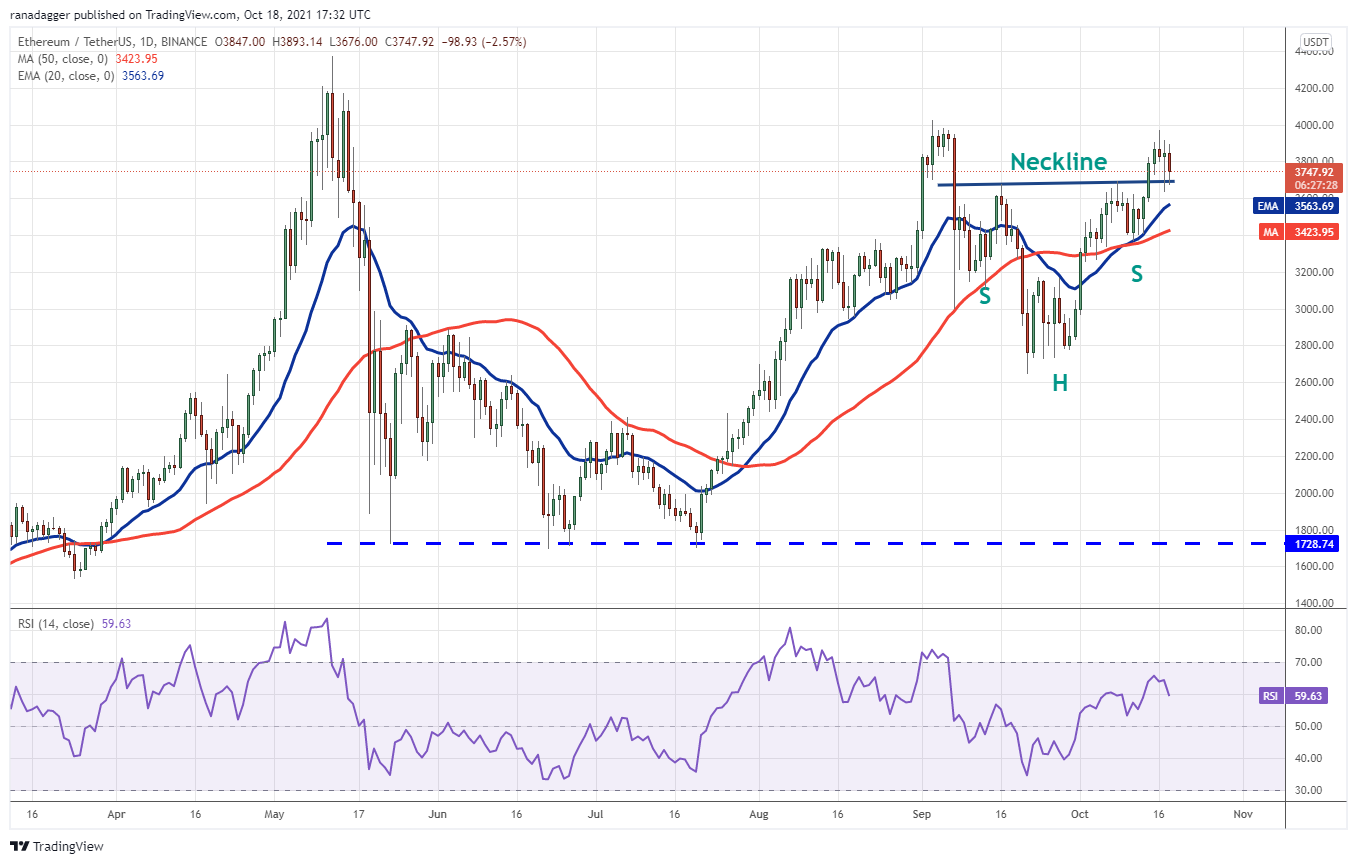
A break below the neckline could result in a decline to the 20-day EMA ($3,563). The rising moving averages and the relative strength index (RSI) in the positive territory indicate that buyers have the upper hand.
If the price rebounds off the 20-day EMA with strength, it will suggest that traders continue to accumulate on dips. The buyers will then make one more attempt to clear the overhead hurdle at $4,027.88.
If they manage to do that, the ETH/USDT pair could retest the all-time high at $4,372.72. Alternatively, if bears sink the price below the moving averages, the pair could correct to $3,200.
BNB/USDT
Binance Coin (BNB) is struggling to take off after completing the inverse H&S pattern on Oct. 13 but a minor positive is that bulls have not allowed the price to sustain below the neckline of the setup.
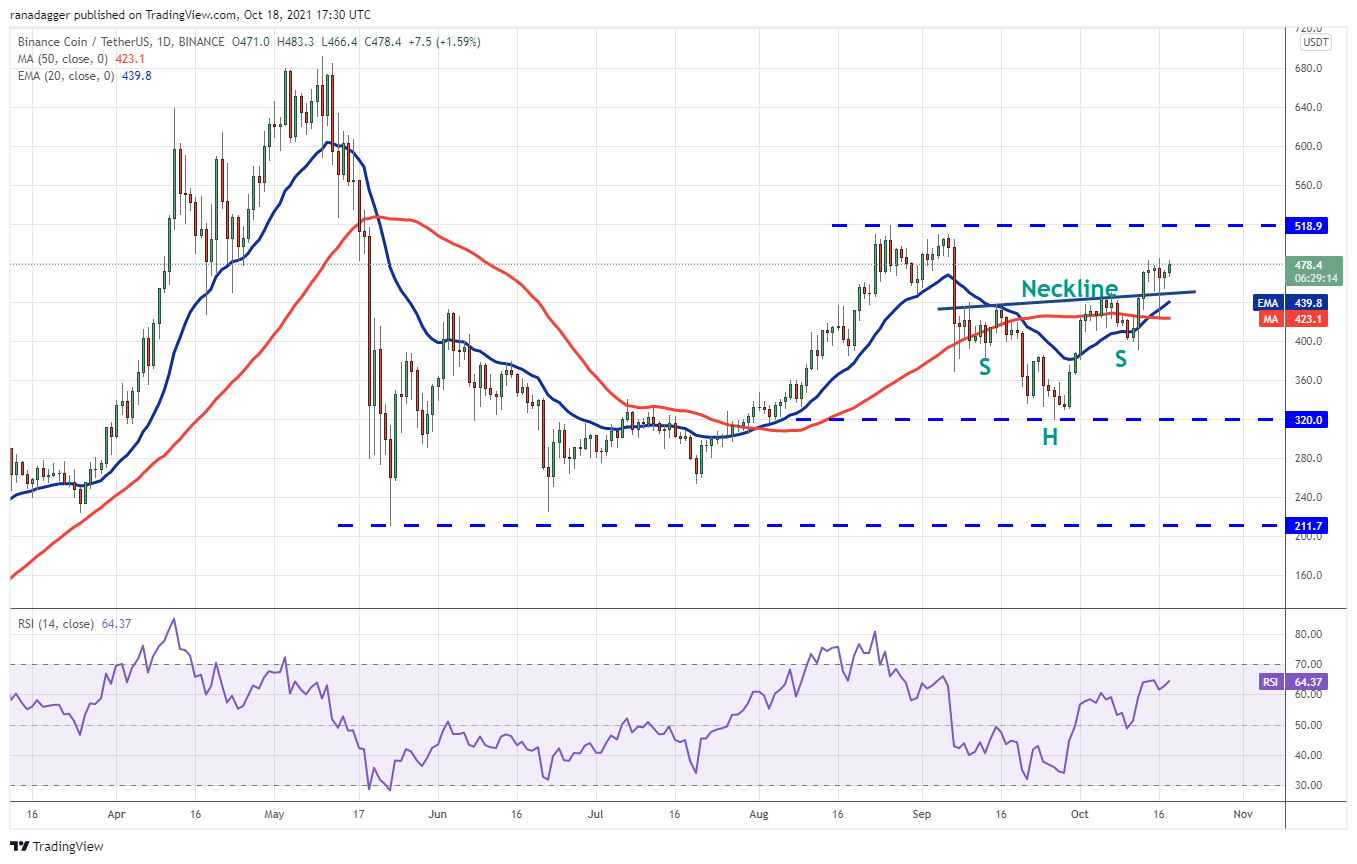
The 20-day EMA ($439) is rising and the RSI is above 64, signaling that the path of least resistance is to the upside. If bulls push the price above $484.70, the BNB/USDT pair could rise to $518.90.
This level may act as a stiff resistance but if bulls overcome this obstacle, the pair could rally to the pattern target at $554.
Contrary to this assumption, if the price turns down and breaks below the moving averages, it will suggest that bears are back in the game. The pair could then drop to $392.20.
ADA/USDT
Cardano (ADA) is trading inside a symmetrical triangle pattern, which suggests indecision among the bulls and the bears about the next directional move.
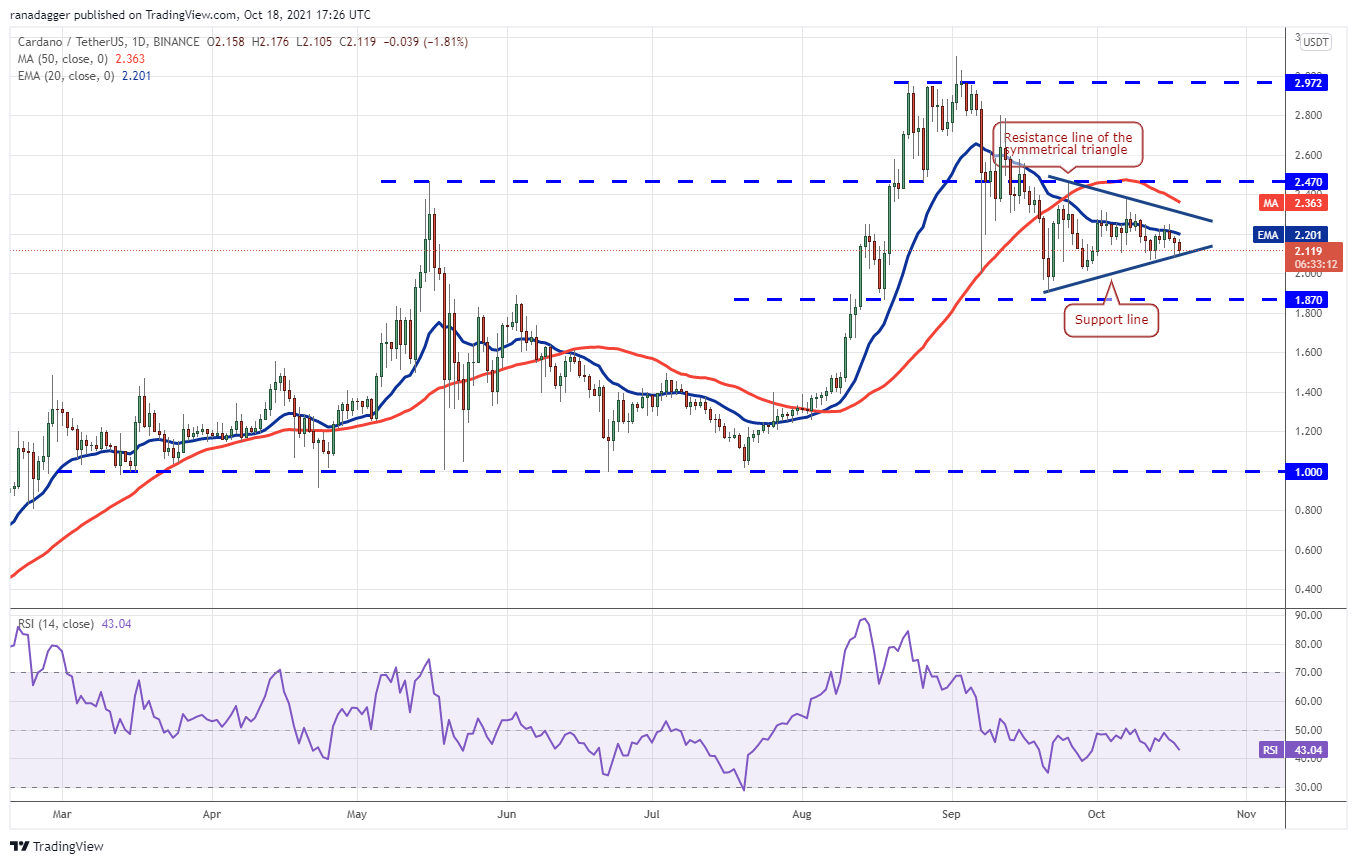
The 20-day EMA ($2.20) is sloping down gradually and the RSI has dropped near 43, suggesting a minor advantage to bears. If sellers sink the piece below the support line of the triangle, the ADA/USDT pair could drop to $1.87.
This level could attract strong buying from the bulls. A breakout and close above the resistance line of the triangle will indicate that bulls have absorbed the supply and made a strong comeback.
The pair could then rally to $2.47, which may act as a resistance but if the bulls overcome this obstacle, the up-move may extend to $2.80.
XRP/USDT
XRP’s attempt to rise above the overhead resistance at $1.24 fizzled out at $1.18 on Oct. 16. This may have attracted profit-booking by short-term traders, resulting in a drop below the moving averages on Oct. 17.
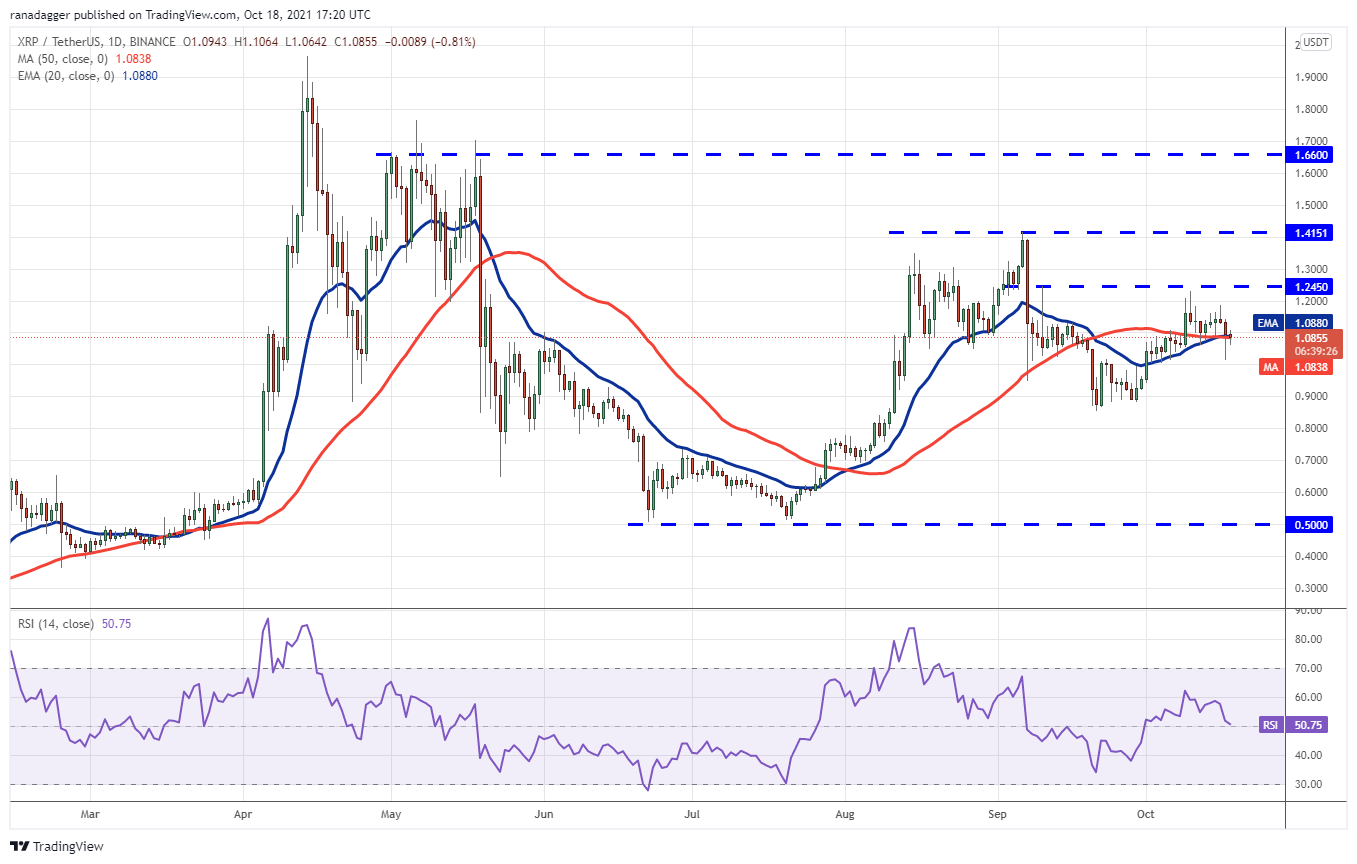
The long tail on the day’s candlestick shows that bulls are aggressively defending the psychological level at $1. Both moving averages have flattened out and the RSI is near the midpoint, suggesting a range-bound action in the short term.
The XRP/USDT pair could consolidate between $1 and $1.24 for a few days. A break and close above $1.24 could clear the path for a possible up-move to $1.41 while a drop below $1 may pull the pair down to $0.85.
SOL/USDT
Solana (SOL) has been sustaining above the downtrend line for the past three days but the bulls are struggling to start an up-move. This suggests that bears have not thrown in the towel yet and are selling on rallies.
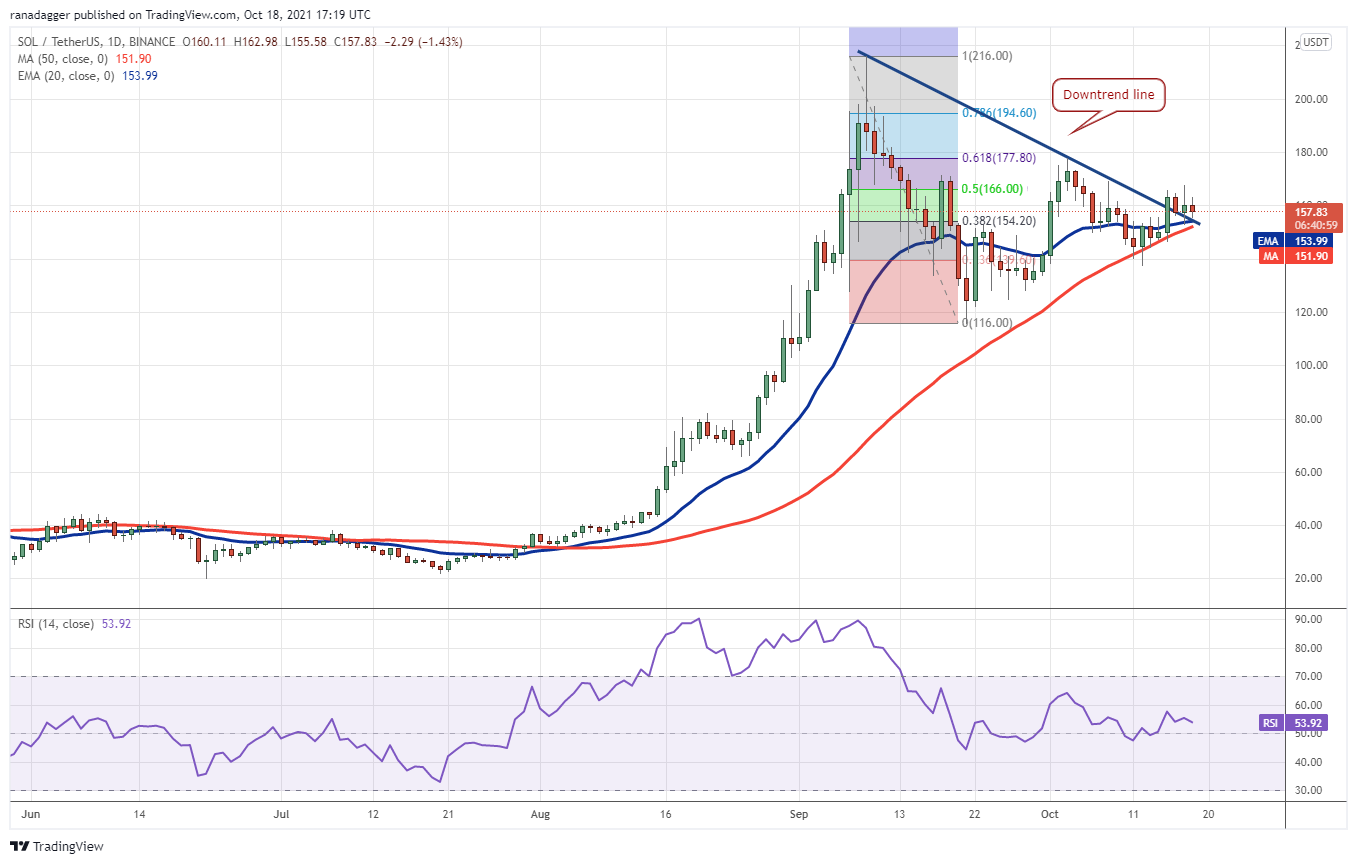
If bears pull and sustain the price below the 50-day SMA ($151), the SOL/USDT pair could drop to $137.61. A break and close below this support could clear the path for a further decline to the important level at $116.
Conversely, if the price rebounds off the current level and sustains above $167.65, it will suggest that buyers are back in the game. The pair could thereafter rally to the 61.80% Fibonacci retracement level at $177.80.
DOT/USDT
Polkadot (DOT) broke above the $38.77 overhead resistance on Oct. 13 but the bulls could not capitalize on this strength. This indicates that bears are unwilling to relent and are selling on every rise.
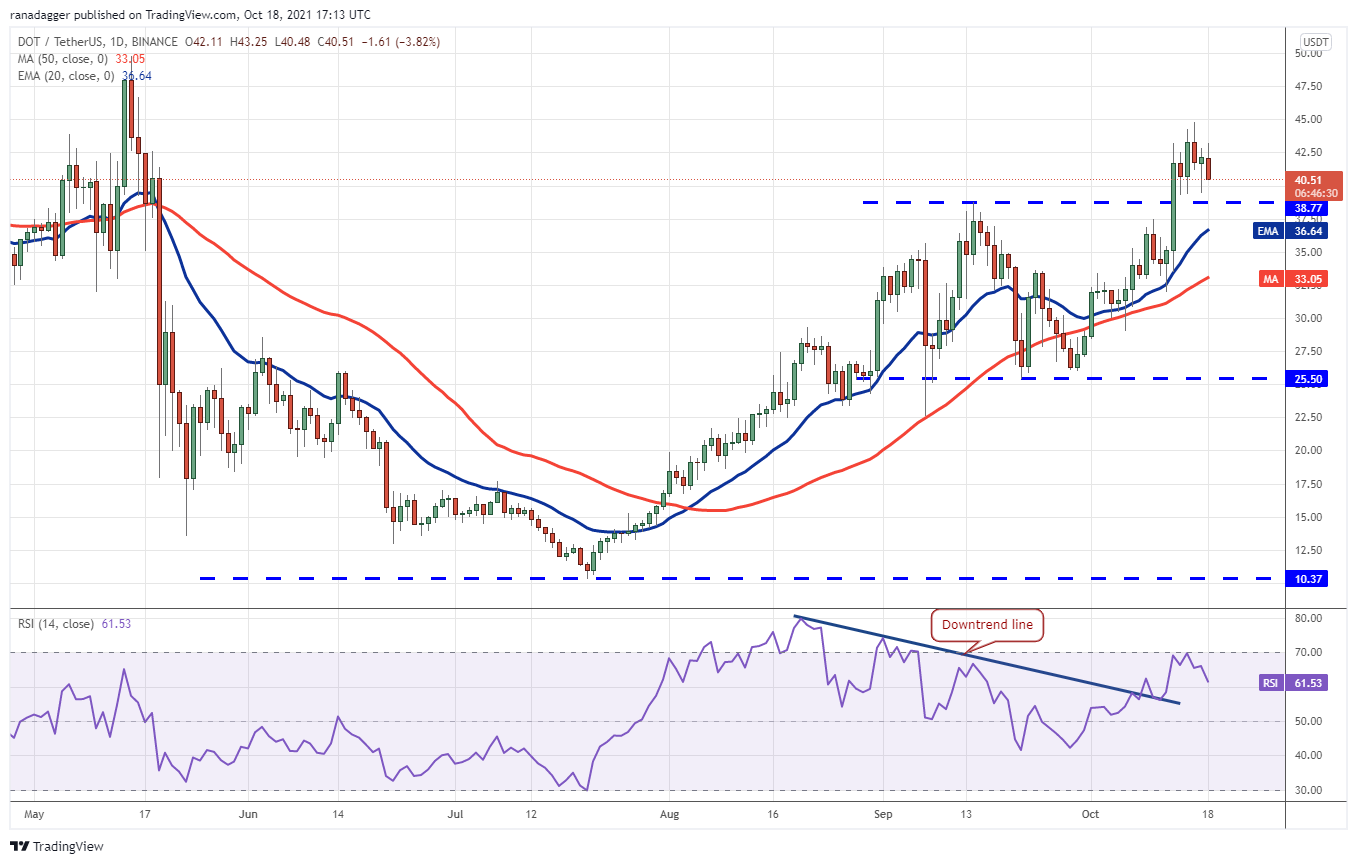
The first sign of weakness will be a drop and close below the breakout level at $38.77 and the 20-day EMA ($36.64). The DOT/USDT pair could then drop to the 50-day SMA ($33.05).
The uptrending 20-day EMA and the RSI in the positive zone indicate that the path of least resistance is to the upside.
If the price rebounds off the current level or $38.77 and breaks above $44.78, it will suggest that bulls are back in the game. The pair may then retest the all-time high at $49.78.
Related: Lushsux: A decade of ass-whoopin’ and skullduggery in a single NFT
DOGE/USDT
The bears pulled the price below the 20-day EMA ($0.23) on Oct. 17 but the long tail on the day’s candlestick suggests accumulation at lower levels. Strong buying today pushed Dogecoin (DOGE) above the downtrend line.
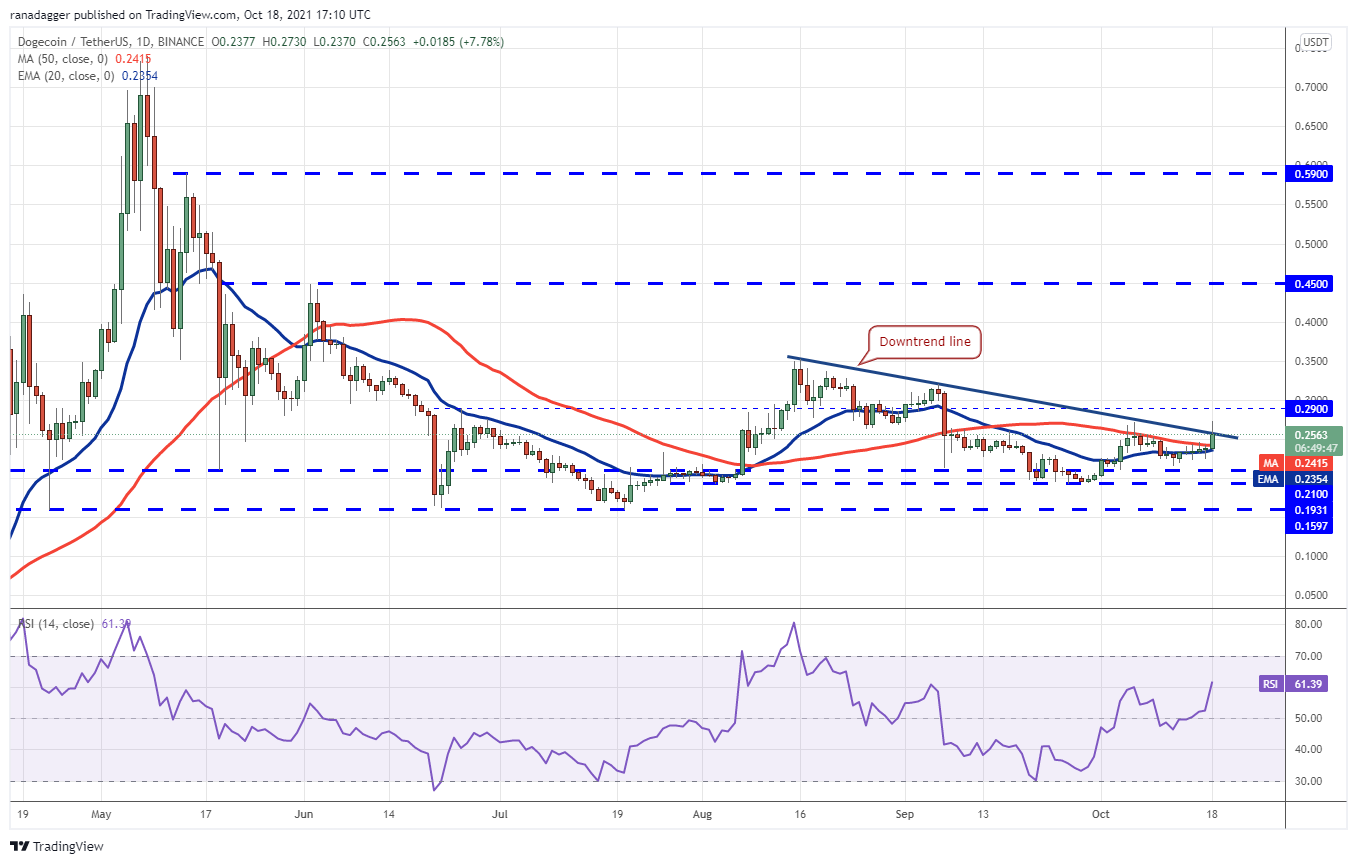
The long wick on today’s candlestick shows that bears are defending the downtrend line aggressively. If bulls fail to sustain the price above the downtrend line, the DOGE/USDT pair could again drop to $0.21.
A bounce off this strong support could keep the pair stuck between $0.21 and the downtrend line for the next few days.
If buyers sustain the price above the downtrend line, it will suggest that correction may have ended. The pair may then rally to $0.32, followed by an up-move to $0.35.
LUNA/USDT
Terra protocol’s LUNA token failed to break above the 20-day EMA ($38.13) in the past few days, suggesting that sentiment has turned negative and bears are selling on rallies.
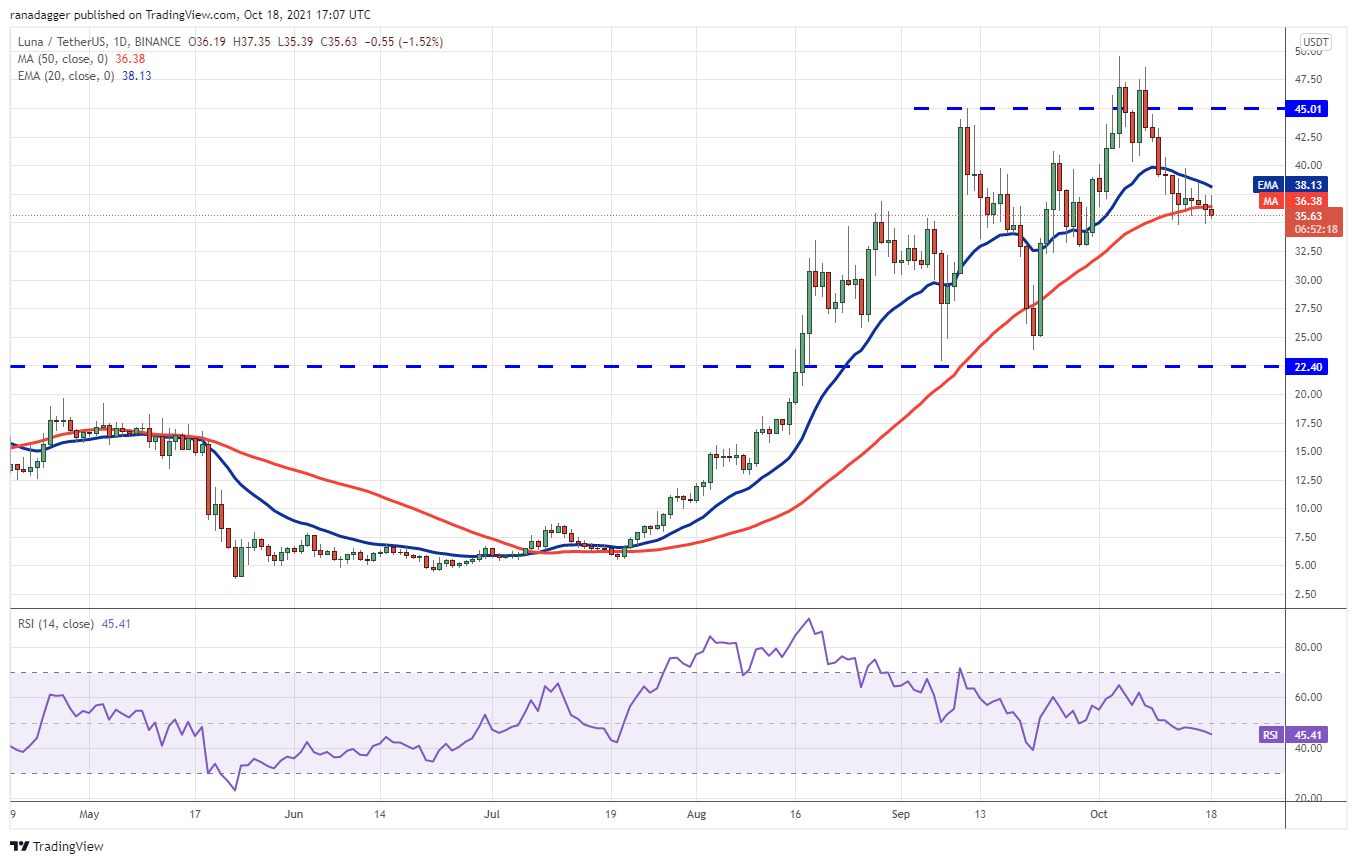
The bears will now try to sustain the price below the 50-day SMA ($36.38). The moving averages are on the verge of a bearish crossover, indicating that the trend favors the bears.
If the price breaks below $34.86, the LUNA/USDT pair could drop to $32.34. This is an important support to keep an eye on because if it gives way, the selling could intensify. The pair could then drop to $25.
The bulls will have to push and sustain the price above the 20-day EMA to indicate that the correction may be over.
UNI/USDT
Uniswap (UNI) broke and closed above the neckline on Oct. 16 but the breakout proved to be a bull trap as bears quickly pulled the price back below the neckline on Oct. 17.
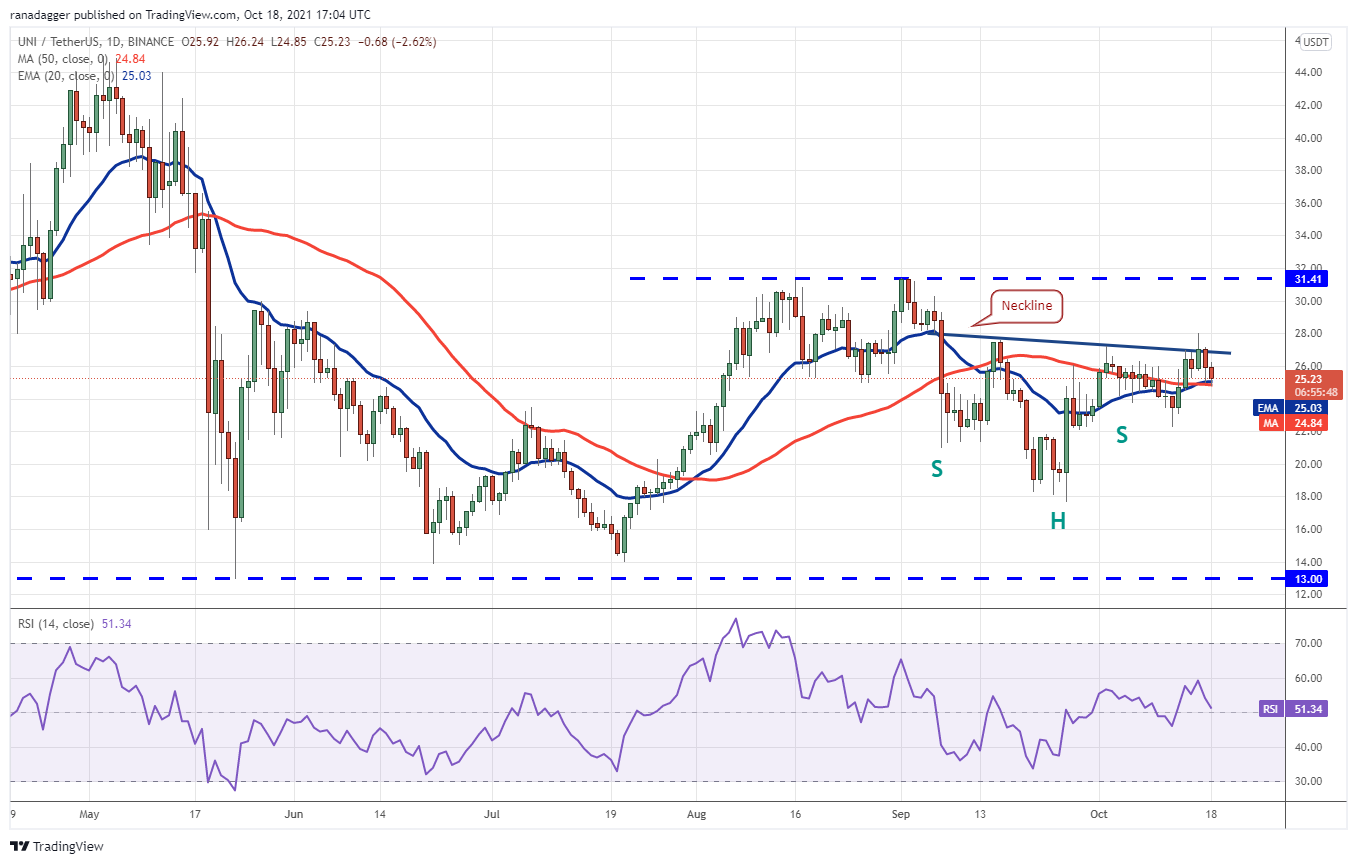
If bears sink the price below the moving averages, the UNI/USDT pair could drop to $22.15. The selling could accelerate if this support is breached and the pair could next drop to $18.
The moving averages are flat and the RSI is just above the midpoint, suggesting a balance between supply and demand.
This equilibrium could tilt in favor of the bulls if they push and sustain the price above the neckline for a couple of days. The pair could thereafter rise to $31.41 and if this resistance is scaled, the rally may reach the pattern target at $36.98.
The views and opinions expressed here are solely those of the author and do not necessarily reflect the views of Cointelegraph. Every investment and trading move involves risk. You should conduct your own research when making a decision.
Market data is provided by HitBTC exchange.


