On-chain data shows that Bitcoin short-term holders have now started to realize significant losses. This could prove to be a bearish signal for the crypto.
Bitcoin Short-Term Holders Are Taking Significant Losses
As pointed out by an analyst in a CryptoQuant post, the BTC market is now looking at significant losses being realized. This trend may be reminiscent of the May 2021 crash.
The relevant indicator here is the Spent Output Profit Ratio (SOPR), which is an on-chain metric. The SOPR measures the profit ratio of the overall market to check whether investors are, on an average, in profit or loss.
The indicator works by looking at the price each coin on the chain was bought at and comparing it with the selling price.
When the value of the SOPR is above 1, it means coins during the period sold at a profit. On the other hand, values below 1 suggest holders were selling at a loss.
Also, naturally, when the indicator’s value is exactly equal to one, the investors were, on average, breaking even for the specific timescale.
A modified version of the metric is the Short-Term Holder SOPR (STH-SOPR), which shows the SOPR for coins that were held for less than 155 days.
Related Reading | Twin Peaks: Comparing The Two 2021 Bitcoin Tops
Now, here is a chart that highlights the trend in the Bitcoin STH-SOPR over the past few years:
Looks like the value of the indicator has gone down recently | Source: CryptoQuant
As you can see in the above graph, the STH-SOPR has decreased in value recently, and the metric is now below one.
This implies that these short-term holders have now started to realize their losses as the price of Bitcoin continues to decline.
Related Reading | Bitcoin, Ether Spike After Fed Announce No Change To Interest Rates
The analyst in the post thinks this trend may be similar to that seen in the aftermath of the May crash. And so, the coin may continue to range sideways for a while, just like then, before observing some uptrend.
BTC Price
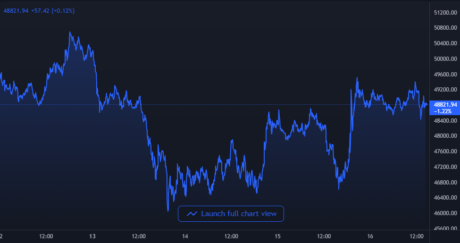
At the time of writing, Bitcoin’s price floats around $49k, down 0.5% in the last seven days. Over the past thirty days, the crypto has lost 20% in value.
The below chart shows the trend in the price of BTC over the last five days.
BTC's price has again continued its sideways trend in the past few days | Source: BTCUSD on TradingView
Bitcoin has been in consolidation for a while now as the price shows no signs of recovery. At the moment, it’s unclear when this sideways movement may end, but if the STH-SOPR is anything to go by, this trend may last a while longer, just like in May.
Featured image from Unsplash.com, charts from TradingView.com, CryptoQuant.com


