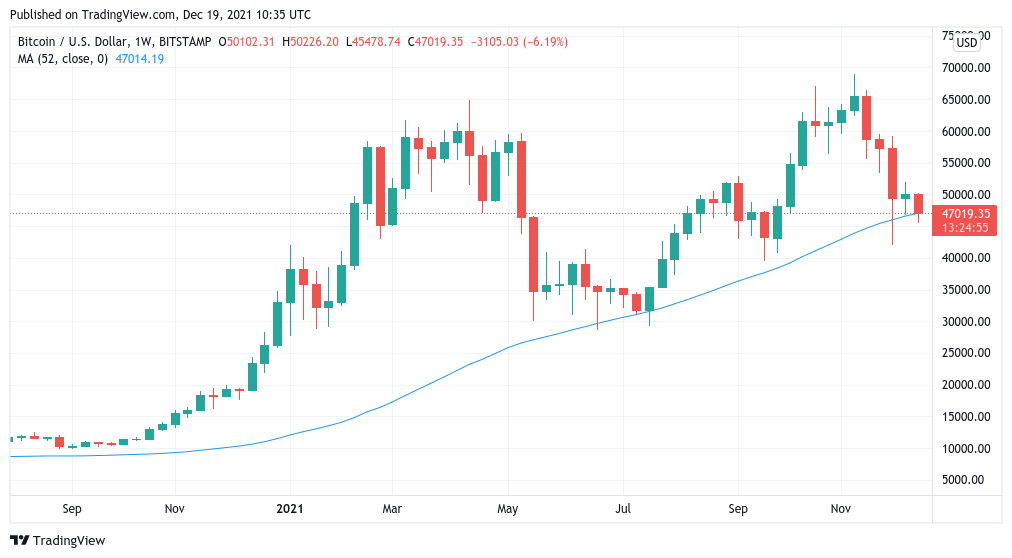
That price is currently the location of Bitcoin’s one-year MA trendline, an important historical line in the sand that has enabled considerable upside if BTC/USD preserves it as support.
“The 1yr MA is a pretty important bitcoin bull/bear pivot level historically and we are sat right on it now,” Philip Swift, creator of on-chain data resource Look Into Bitcoin, commented.
“I vote we bounce and stay bull.”
BTC/USD 1-week candle chart (Bitstamp) with 52-week MA. Source: TradingView
A bounce would still leave a vast amount of ground to recover in order to post an end-of-year closing price even slightly in line with previous bullish expectations.
Among them are those of stock-to-flow model creator PlanB, who at the weekend acknowledged that his $100,000 target for 2021 was unlikely to hit.
He added that he would not be abandoning his models, which remain valid despite recent events.
Bitcoin needs a small miracle for a 100K Christmas. Will I ditch S2F model if this does not happen? Nah, I actually like being at the lower bands. In fact I published the model at the lower bands in March 2019 with btc below 4K. pic.twitter.com/L1m0jFGNYM
Comments from the United States Federal Reserve provided a short-lived performance boost, but overall, progress has been limp compared to earlier in the year.
“Look as if mkts not staging typical Santa Rally,” markets commentator Holger Zschaepitz concluded.
“Global stocks have lost $1.8tn in mkt cap this wk as investors reacted to hawkish Fed pivot, spike in Covid cases & find themselves positioning into 2022 of already-elevated valuations. Stocks still worth $118tn, 140% of global GDP.”