The views and opinions expressed here are solely those of the author and do not necessarily reflect the views of Cointelegraph. Every investment and trading move involves risk, you should conduct your own research when making a decision.
Market data is provided by the HitBTC exchange.
Bitcoin showed a glimpse of its former self when it skyrocketed by about 20 percent on April 2. With no specific news responsible for the rise, we can only speculate on what caused the sudden spurt in prices. Many theories have been put forth, one being a large order either by an individual trader or a group of traders that caused the price to break above the overhead resistance, following which the algorithms spotted the breakout and piled on long positions. Many traders who had been short on the digital currency were forced to cover their positions, which may have added fuel to the rally.
However, these are only assumptions. The important question to ask is whether this rally can sustain. If we only see a minor pullback across the board, it will confirm that a bottom is in place and that cryptocurrencies are about to start a new uptrend. This will force the investors sitting on the sidelines to jump in, which can push prices higher.
If the prices fail to sustain the higher levels, it will indicate that the current rally was only an aberration. There are advocates for both sides of the trade, but we believe in letting the markets do the talking. Let’s see what the charts say and devise our strategy accordingly.
BTC/USD
Bitcoin (BTC) led from the front on April 2, as it broke out of the overhead resistance at $4,255 and soared close to $5,000. By sustaining above $4,255, it completed a double bottom pattern that had a target objective of $5,273.91. Currently, the leading digital currency is a tad below this level.
Between the current levels and $5,900, there is no significant resistance point. However, the RSI has entered deep into overbought territory, which can result in a couple of days of consolidation or a minor correction. Hence, traders can book profits on about 30 percent of the long positions at the current levels and buy on dips once again. The stop loss on the rest of the position can be kept at $4,200.
The BTC/USD pair might pull back towards $4,400 in a retest of the breakout level. If it rebounds sharply from the support, it will confirm a bottom and the start of a new uptrend. The moving averages are trending higher, which shows that the bulls have the upper hand. Our bullish view will be negated if the price plunges below $4,255. Such a move will indicate a lack of buying and formation of shorts at higher levels.
ETH/USD
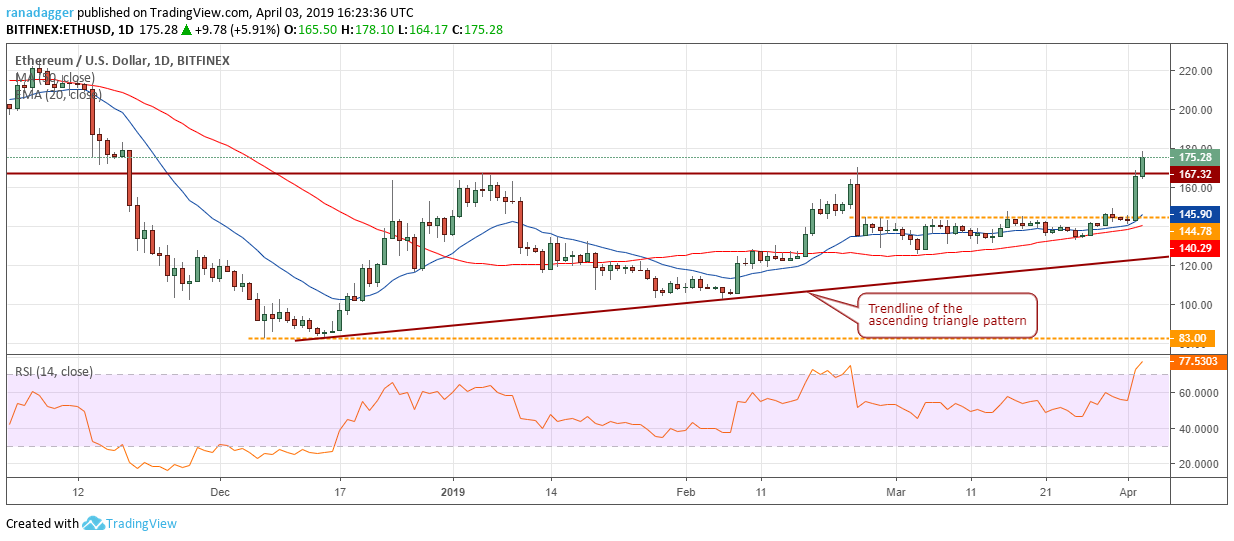
Ethereum (ETH) has broken out of the overhead resistance at $167.32. If the bulls manage to close (UTC time frame) above this level, it will complete an ascending triangle pattern. The target objective of this bullish setup is $251.64.
If the ETH/USD pair fails to sustain above $167.32, it can fall back into the triangle. It will weaken if it plunges below the support at $145. The moving averages are sloping up and the RSI is in overbought territory. This shows that the bulls are in command and any pullback should quickly find buying support. For now, traders can keep a stop loss of $140 on the remaining long positions. We shall trail the stops higher again in a couple of days.
XRP/USD
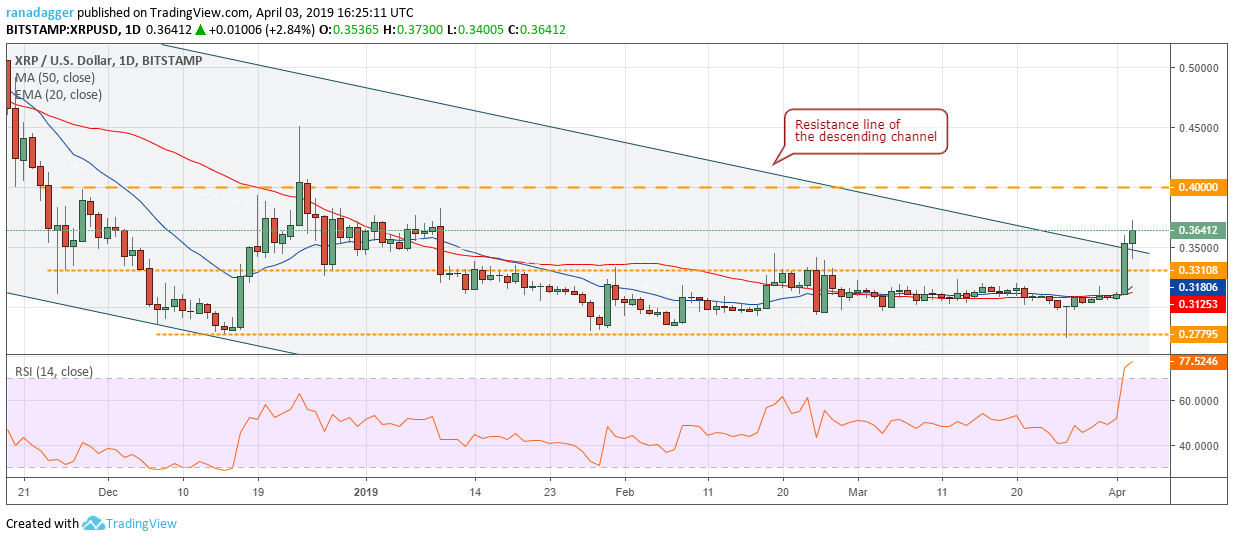
Ripple (XRP) broke out of both the overhead resistance of $0.33108 and the resistance line of the descending channel on April 2. Such a large range move after days of consolidation in a tight range is a bullish sign. It shows a probable change in trend that can first carry the digital currency to $0.40 and above it to $0.45097. The medium-term target is $0.60.
Typically, the price retests the breakout level and then resumes the up move. Therefore, we anticipate a couple of days of consolidation or a minor correction, which should find support at $0.33108. Traders can wait for this retest to be successful before initiating long positions once again. But if the XRP/USD pair fails to stay above $0.33108 during the next pullback, it will be a negative sign.
LTC/USD
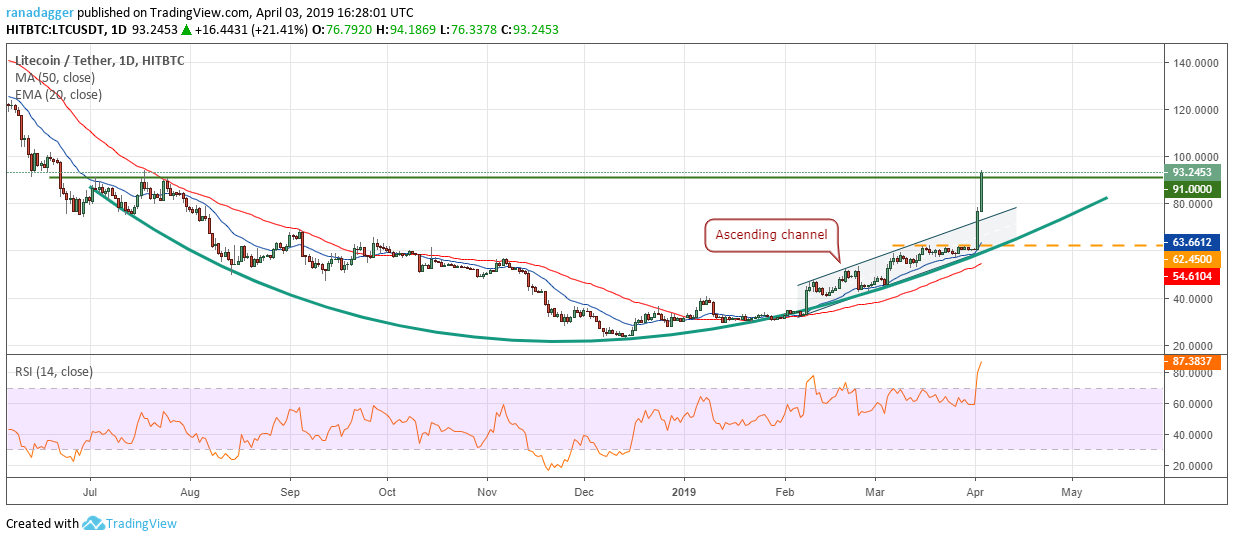
Litecoin (LTC) blasted off the overhead resistance of $62.45 and easily exceeded our target of $69.2790. It is currently on the road to $100. We expect a strong resistance between $91–$100, hence, we suggest traders’ book complete profits on the remaining long positions at the current levels.
The trend is bullish as both the moving averages are sloping up and the RSI is in the overbought zone. Therefore, we shall again look to buy the cryptocurrency on dips to strong support levels.
We find a large rounding bottom pattern, which will complete on a breakout and close (UTC time frame) above $91. This is a bullish reversal pattern and has a minimum target objective of $159.
The LTC/USD pair will lose momentum if it turns around from the current levels and plummets back into the ascending channel.
EOS/USD
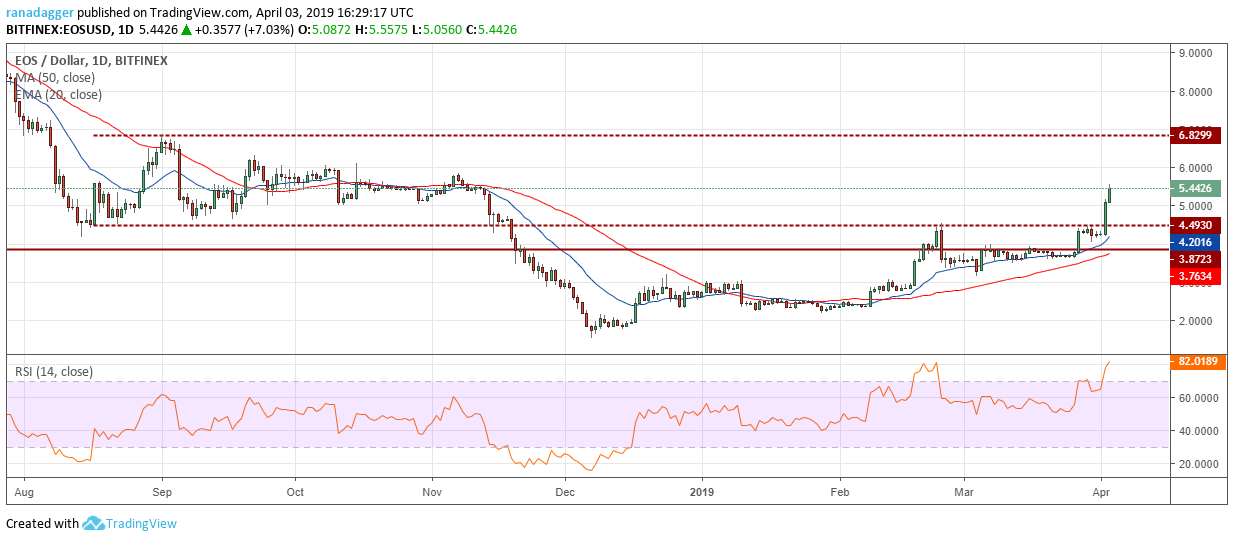
EOS scaled above the overhead resistance of $4.4930 on April 2 and is currently close to our target objective of $5.8370. Both the moving averages are trending up and the RSI is in the overbought zone, which shows that the bulls are firmly in command. However, a few days of consolidation or a minor correction cannot be ruled out.
Any pullback from the current level should find support close to the breakout level of $4.4930. A successful retest of this level will be a positive sign. In the medium-term, the EOS/USD pair can rally to $6.8299. Therefore, traders can trail the stops on the remaining long positions to $4.40. We might suggest booking partial profits once again if we find the rally faltering. The pair will turn negative if it fails to sustain above $4.4930.
BCH/USD
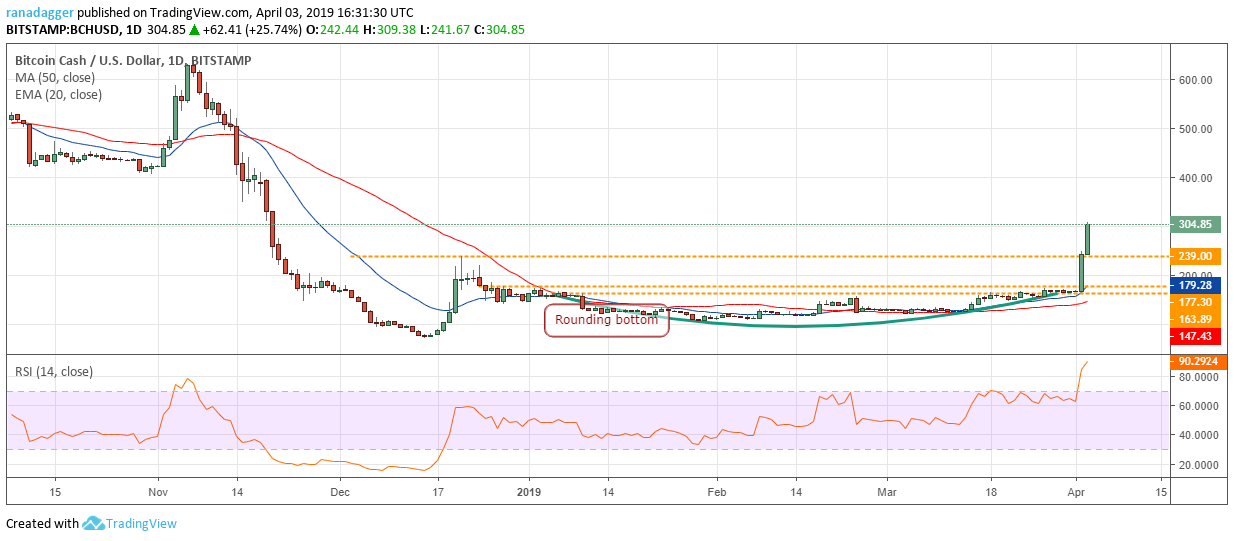
Bitcoin Cash (BCH) skyrocketed on Tuesday and followed it up with further gains on Wednesday. With the latest rise, it has exceeded the target objective of $249.60. Traders can pocket 40 percent of the gains around the current levels and raise the stop loss on the remaining long positions to $210. The RSI has shot deep into the overbought zone; hence, a minor correction or consolidation cannot be ruled out.
We do not recommend closing out the complete position because the BCH/USD pair does not have any significant resistance up to $400 and it also has a history of vertical rallies.
Our bullish view will be invalidated if the bears sink and sustain the price below $239. This will show profit booking at higher levels and a lack of follow up demand by the bulls. As long as the digital currency stays above $239, it is on target to move higher.
BNB/USD
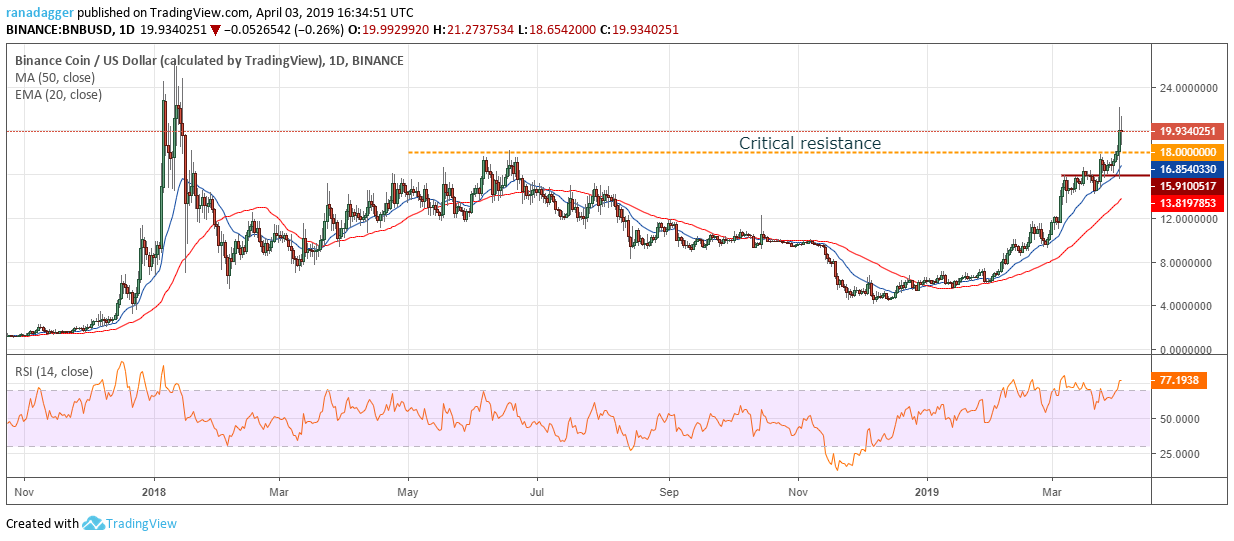
Binance Coin (BNB) broke out and closed (UTC time frame) above the critical overhead resistance of $18 on April 2. This is a bullish sign as it shows demand even at higher levels. With the latest rise, the cryptocurrency has come very close to the lifetime highs at $26.4732350. This is a major sentiment booster as it confirms that the prices reached during the peak of the crypto mania in January 2018 can be scaled.
However, the BNB/USD pair has rallied sharply from the lows, hence, some amount of profit booking and a consolidation in the short term is a possibility. Therefore, traders can trail the stop loss on the remaining long positions to just below the 20-day EMA. Traders can even pocket the complete gains on a spike to $25, if it happens.
The trend remains strong as both the moving averages are sloping up and the RSI is in the overbought zone. A breakdown of the 20-day EMA will be the first sign of weakness. Until then, the cryptocurrency remains strong and on target to retest the lifetime highs.
XLM/USD
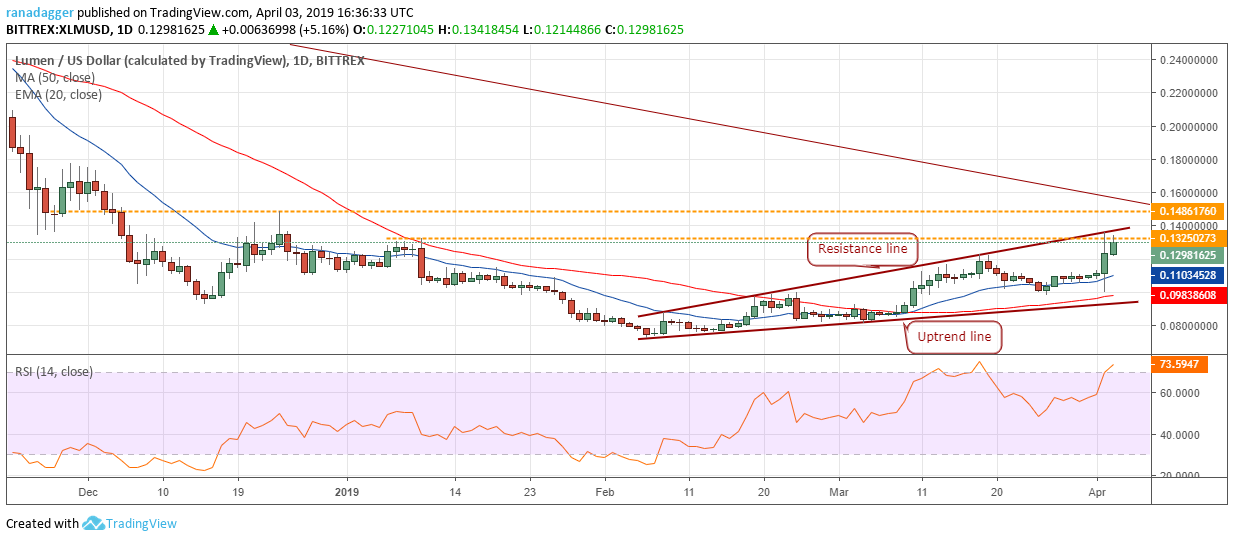
Stellar (XLM) rose to hit our first target objective at $0.13250273. If this level is scaled, the next target is $0.14861760. This will act as a major roadblock because the long-term downtrend line is just above this level. Therefore, traders can book profits on 40 percent of the long positions close to $0.13 and trail the stops on the rest to break even.
With both the moving averages gradually sloping higher and the RSI in the overbought zone, the bulls continue to be in the driver’s seat. Therefore, we are not recommending closing out the complete position.
But if the XLM/USD pair turns down from the overhead resistance levels, it can dip to the 20-day EMA, which should provide a strong support. The trend will turn in favor of the bears on a breakdown of the uptrend line.
ADA/USD
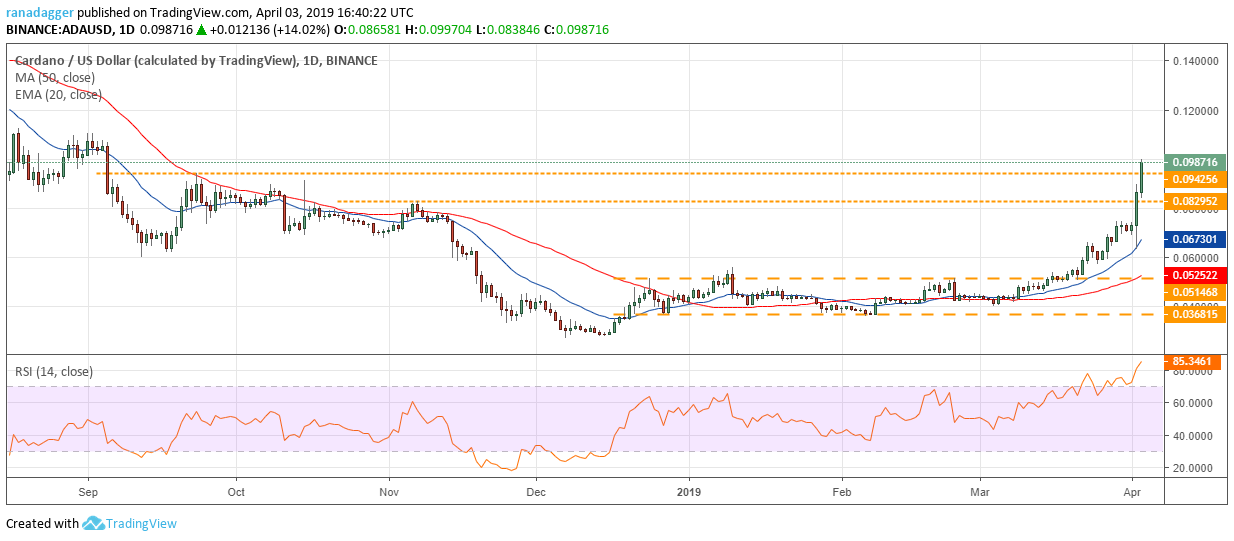
Cardano (ADA) has reached both our target levels of $0.082 and above it $0.094. The sharp rally has carried the RSI into overbought territory and the price is currently at a stiff resistance. Hence, we might see a few days of consolidation or a minor correction at these levels. Traders can book profits on 50 percent of the remaining long positions and hold the rest with the stops at $0.075.
The momentum is strong and a break out of $0.094256 can push the price to the next resistance at $0.112598. If the bulls scale $0.112598, we can expect a rally to $0.20 as there is no major barrier in between. But it is more of a medium-term target than a short-term target.
If the ADA/USD pair reverses direction from the current levels, it can correct to $0.082952, which should act as a strong support. If both these levels break down, a slide to the 20-day EMA is probable. Hence, we always suggest to book partial profits and trail the stops higher.
TRX/USD
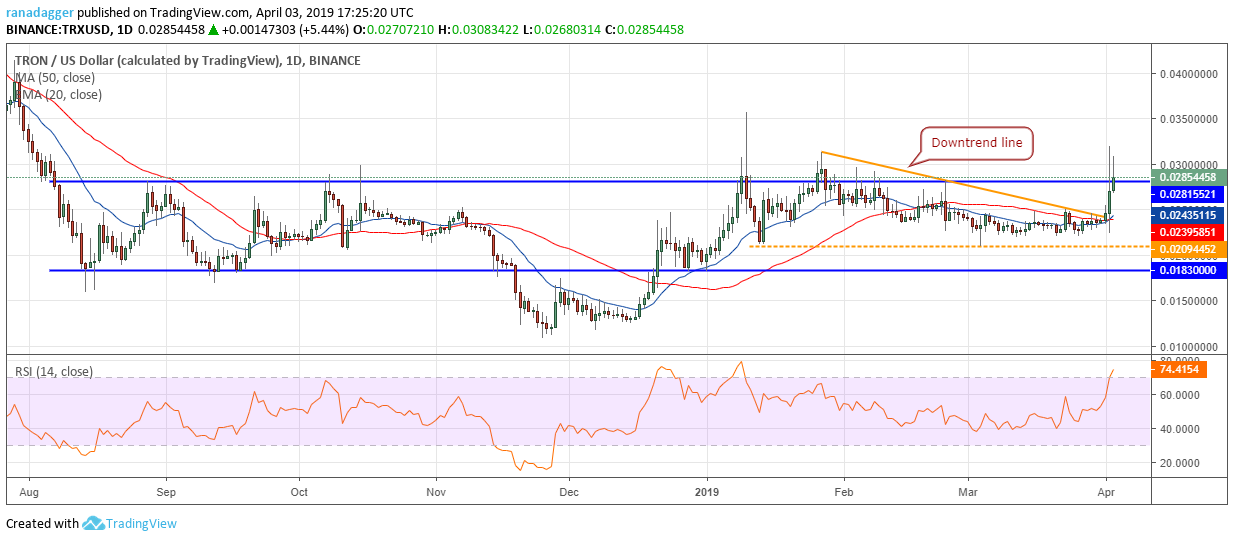
Tron (TRX) broke out of the overhead resistance at $0.02815521 on March 2 but could not close (UTC time frame) above it. The bulls again pushed prices above the resistance line today but are struggling to hold the higher levels. This shows a lack of demand at higher levels. As the price did not close above $0.02815521, our buy proposed in the previous analysis has not triggered.
If the bulls manage to sustain the price above $0.02815521, it will increase the probability of the start of a new uptrend. The pattern targets on the upside are $0.040 and above it $0.0480. Conversely, if the TRX/USD pair turns down from the current levels, it will extend its stay in the range for a few more days.
Market data is provided by the HitBTC exchange. Charts for analysis are provided by TradingView.


