Bitcoin (BTC) has not experienced any substantial market movement since June 4.
The world’s leading cryptocurrency has been fluctuating between $7,440 and $8,100 from the last seven days. The move has established a strict $600-wide sideways pattern, which is offering day traders plenty of opportunities to enter and exit the market on smaller profits. The bulls so far have failed to secure a breach above $8,100, now a crucial resistance level of the sideways channel. At the same time, the bears have struggled to execute a similar action below $7,440.
The bitcoin price, for now, has entered a bias conflict zone, wherein its probability of trending sideways is growing higher in the absence of stronger volume. Traders are waiting for big whales to set the next course of bitcoin trend. But nobody exactly knows the direction the price would pursue: north or south.
Sideways is the New Bitcoin Bias
According to cryptocurrency analyst pseudonym, the Crypto Dog, it is wiser for small traders to park their funds into a stablecoin unless a big move decides the next bitcoin trend. The analyst said he is betting on the cryptocurrency to fall further towards $7,000 but is unsure about achieving the said target, anyhow.
“Patience will pay off, we’ll get a clear direction for the market soon enough.” said the Crypto Dog.
So far, so nothing. As exciting as today was, bulls haven’t managed to secure a breach past a significant resistance. We’re still much in the same boat as yesterday, more waiting…$BTC $BTCUSD #Bitcoin pic.twitter.com/E4kHi8kcZZ
— The Crypto Dog📈 (@TheCryptoDog) June 11, 2019
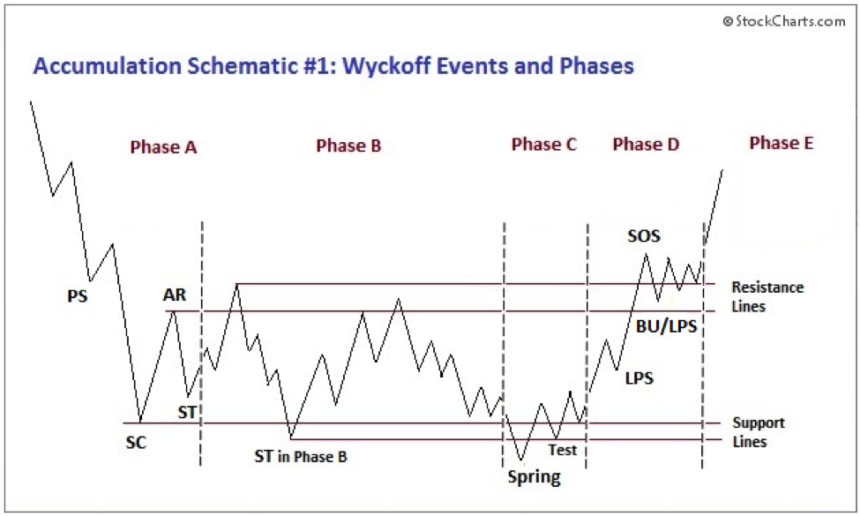
Josh Rager, another prominent cryptocurrency analyst, settled his downside target $500 higher than that of the Crypto Dog — based on a textbook trading method known as the Wyckoff Method. The process typically involves a five-step approach, as shown in the chart below:
According to Rager, the bitcoin price was in Phase C, which means it would bounce back from the support range defined by $7,440 and $7,570 to enter Phase D. The move would further prompt bitcoin to retest the so-called SOS level of $8,117 before continuing higher in the upward direction.
“In my opinion, the more it goes sideways, the more likely it’s accumulation,” said Rager.
$BTC – an idea for continuation up over $8ks pic.twitter.com/fvYvphILfN
— Josh Rager 📈 (@Josh_Rager) June 11, 2019
When Bitcoin Becomes Stable
It is not the first time when bitcoin is continuing its business without showing its trademark volatility. The cryptocurrency’s slow volatility typically marks the end of a bearish trend. According to Victor Dergunov, the founder of Albright Investment Group, bitcoin’s humble price swings come when its bearish bias shows signs of exhaustion.
“Primarily, similar low volatility phenomenon has occurred in the very late stages of bitcoin bear markets [whereby prices fall as investors sell],” he had said ahead of November 2018 crash. “Everyone seemingly loses interest, volume dries up, news flow quiets down, and then, when you least expect it, the next bitcoin bull market begins [whereby prices rise as investors buy].”
One month later, on December 13, 2018, bitcoin bottomed out in $3,100-3,200 range and rebounded by as much as 190 percent.
The cryptocurrency experienced another but a relatively smaller stable period above $3,600 in February this year, as covered by NewsBTC here. Nevertheless, despite a weaker support level, the price later marched towards $4,200 in March and to $9,090 ahead of the May close.
That explains why analysts are finding accumulation opportunities in bitcoin’s ongoing sideways trend.
Featured Image from Shutterstock. Charts Courtesy of TradingView.com


