The quick pullback from the lows shows demand at lower levels. Is this a good point to enter or will the correction deepen? Let’s look at the charts.
The views and opinions expressed here are solely those of the author and do not necessarily reflect the views of Cointelegraph. Every investment and trading move involves risk, you should conduct your own research when making a decision.
Market data is provided by the HitBTC exchange.
The bashing of Libra continues, with G7 finance ministers warning that if the project is not regulated tightly, it can upset the global financial system. The ministers are against a private company issuing its own currency without any control.
Nonetheless, the project got support from unexpected quarters. The head of Germany’s central bank Jens Weidmann, who previously was not very supportive of cryptocurrencies, said during a G7 event that the regulators should not try to kill the project without allowing it to prove itself. If Libra can deliver on its promises, it can be attractive to consumers.
Even before its launch, Libra is challenging the way money is being transferred across borders. BlackRock CEO Larry Fink, though not supportive of Libra, said that the high transaction fees of five to ten percent for cross-border transactions will have to be dealt with using technology.
United States Treasury Secretary Steven Mnuchin continued his tirade against cryptocurrencies, repeating the same old story of how cryptocurrencies can be used for illicit purposes such as money laundering.
We believe that these attempts to suppress the rise of cryptocurrencies will only cause a temporary hurdle in the short term. The long-term story remains optimistic and cryptocurrencies will only emerge stronger than before.
BTC/USD
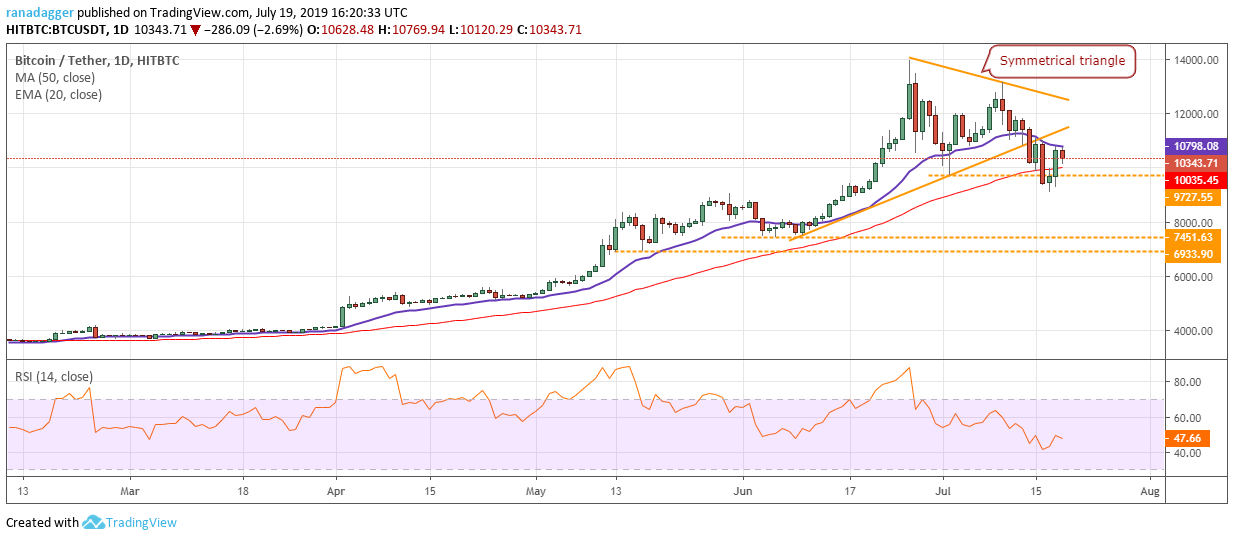
Bitcoin (BTC) continues to be the strongest cryptocurrency. The dip below the 50-day SMA was bought aggressively and the price has reached the 20-day EMA. This shows strong demand at lower levels. However, the bears are trying to defend the 20-day EMA.
If the BTC/USD pair turns down from current levels and plummets below $9,080, it will indicate a change in trend. The next support on the downside is at $7,451.63. The 20-day EMA is marginally down and the RSI is just below 50, which suggests that bears only have a slight advantage.
Conversely, if the next dip to $9,080 holds or if bulls scale above the 20-day EMA, it will indicate strength. We view this fall as a buying opportunity, but we will wait for a bottom to form before proposing a trade in it.
ETH/USD
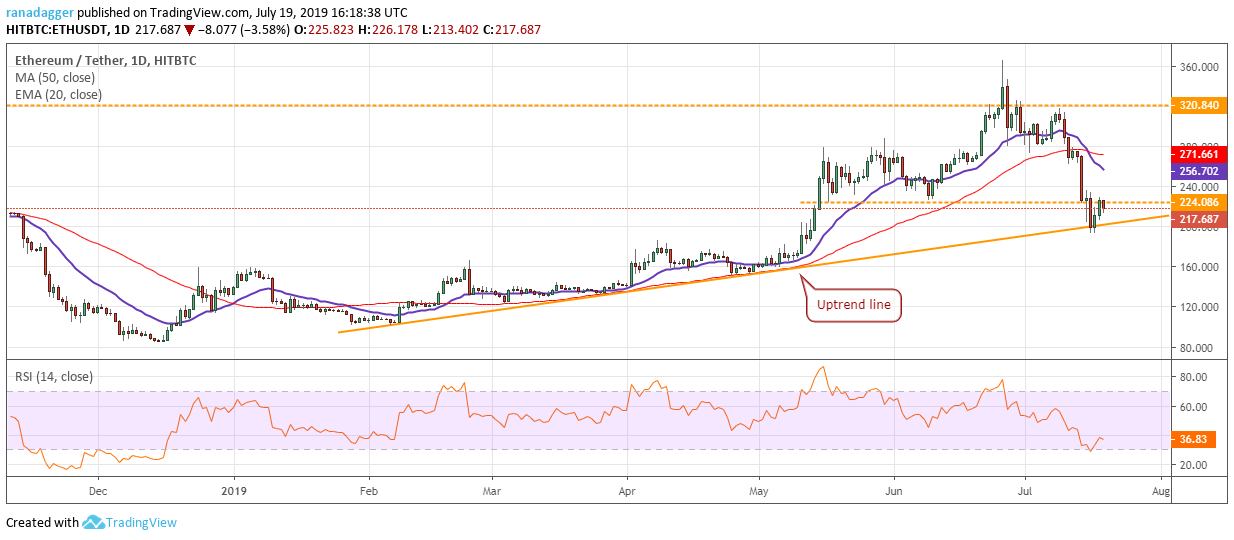
The pullback from the uptrend line hit a barrier at $$224.086. This level, which had previously acted as support will now act as resistance. With the 20-day EMA sloping down and the RSI in negative territory, the advantage is clearly with the bears. They will now try to sink Ether (ETH) below the uptrend line once again. If successful, it can drop to $150.
Contrary to our assumption, if the price rebounds from the uptrend line and sustains above $224.086, it can move up to the 20-day EMA. The ETH/USD pair has been among the stronger altcoins, hence, it might outperform when the recovery starts. We will wait for the uptrend to resume before suggesting a long position in it.
XRP/USD
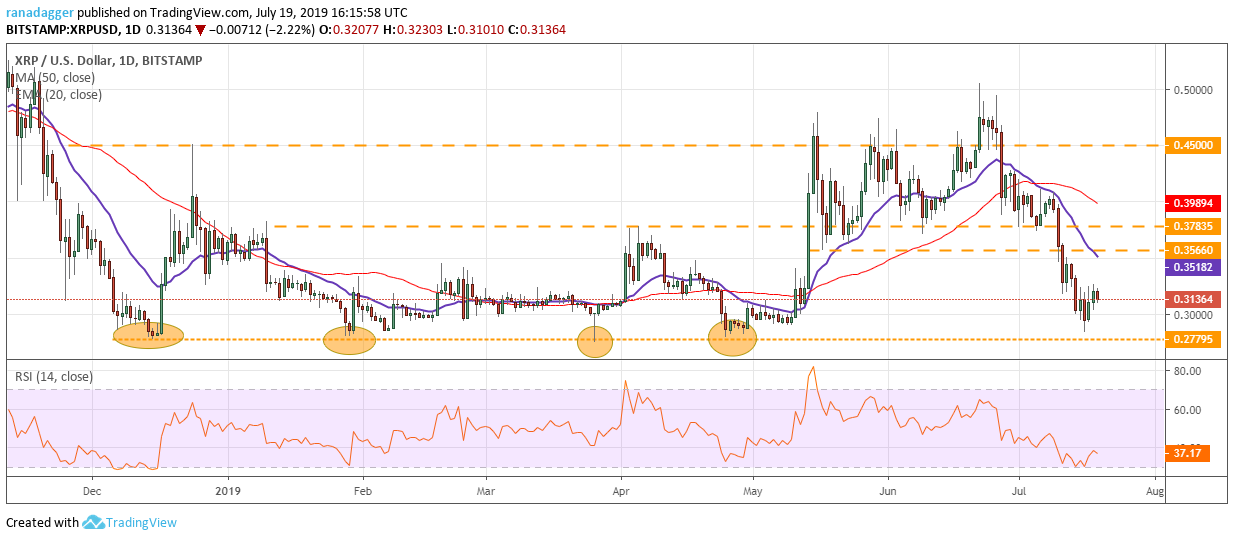
The bounce in Ripple (XRP) from close to the critical support of $0.27795 is facing resistance at $0.3270. If bulls defend the next dip towards $0.27795, it will indicate demand at lower levels and might suggest a range formation.
Nevertheless, if the bears sink the XRP/USD pair below $0.27795, it will be very negative because this support has held on five previous occasions since mid-December last year. There is a minor support at $0.24508 below which the downtrend will resume. Both moving averages are trending down and the RSI is in the negative zone, which shows that the pair is in a firm bear grip. As the pair has been an underperformer, we will wait for buyers to return and a reversal setup to form before recommending a trade in it.
LTC/USD
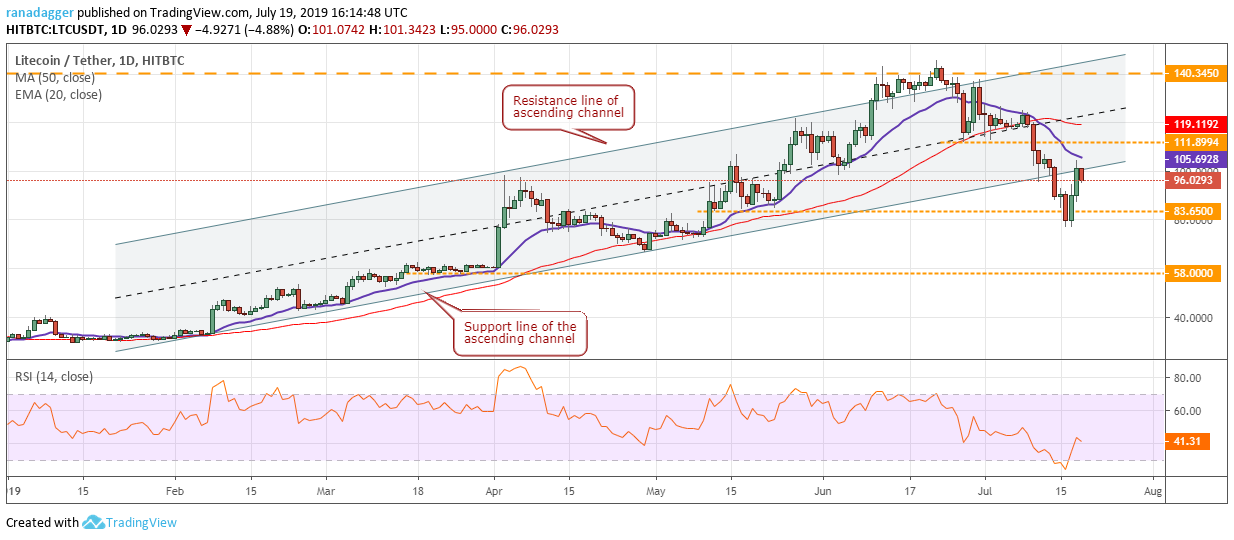
Litecoin (LTC) rose sharply from close to $76, but hit a wall at the 20-day EMA. The previous support line of the channel will now act as a stiff resistance. If the digital currency turns down and breaks below $76, it can fall to the next support at $58.
However, if the next down move holds above $76, it will indicate buying at lower levels. The pullback will signal strength on a breakout above 20-day EMA. The pair is one of the stronger altcoins, hence, traders should watch it carefully. We will wait for the LTC/USD pair to re-enter the channel and sustain it before recommending a long position in it.
BCH/USD
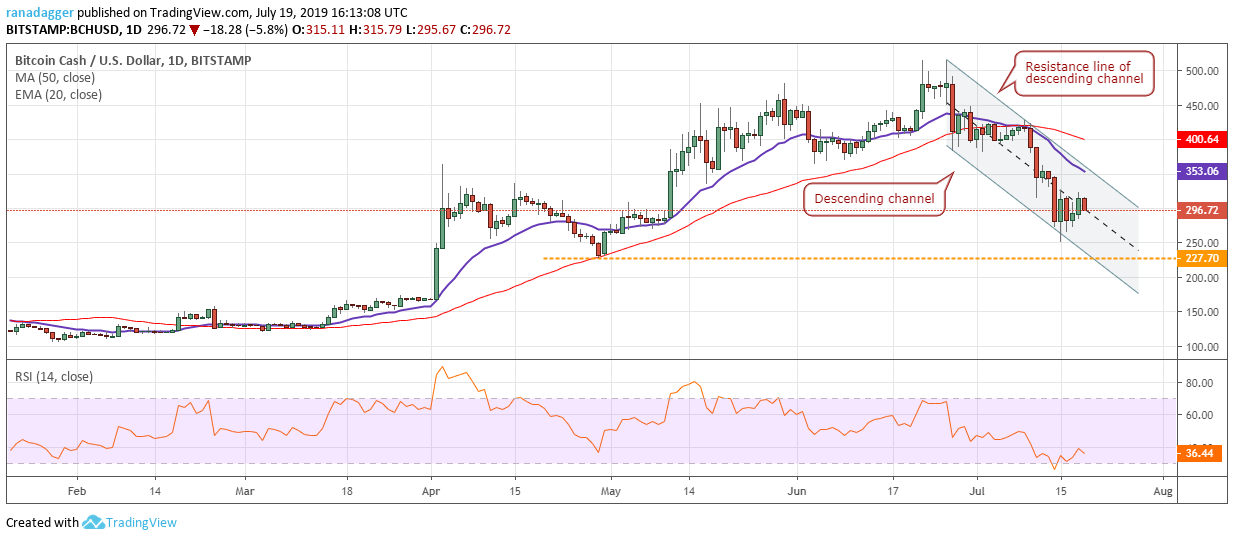
Bitcoin Cash (BCH) is trading inside a descending channel. The recovery is facing selling close to $325. If the price breaks out of this overhead resistance, it can move up to the resistance line of the channel. A breakout of the channel will indicate a change in trend.
On the other hand, if the BCH/USD pair turns down from the current level and breaks below $250, it can drop to $227.70. If this level also cracks, we can expect a deeper fall to $166.98. Both moving averages are sloping down and the RSI is in the negative zone, which suggests that the bears are at an advantage. Traders can wait for a trend reversal before initiating fresh long positions in it.
BNB/USD
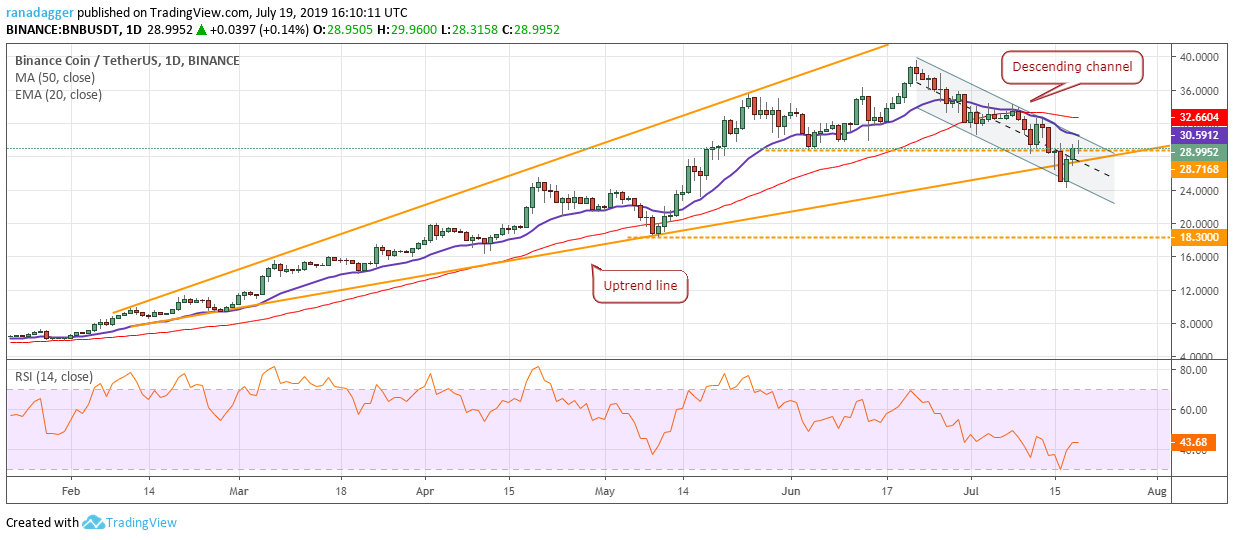
Binance Coin (BNB) is trading inside a descending channel. The bulls were able to push the price back above the uptrend line on July 18, which is a positive sign. Currently, the 20-day EMA is likely to act as a stiff resistance.
If the BNB/USD pair turns down from the resistance and breaks below the recent low of $24.1709, it can drop to the next support at $18.30. However, if the bulls succeed in keeping the price above the uptrend line, it will indicate strength. The pair has been an outperformer, hence, it is on our radar. We will wait for the price to sustain above the 20-day EMA before proposing a trade in it.
EOS/USD
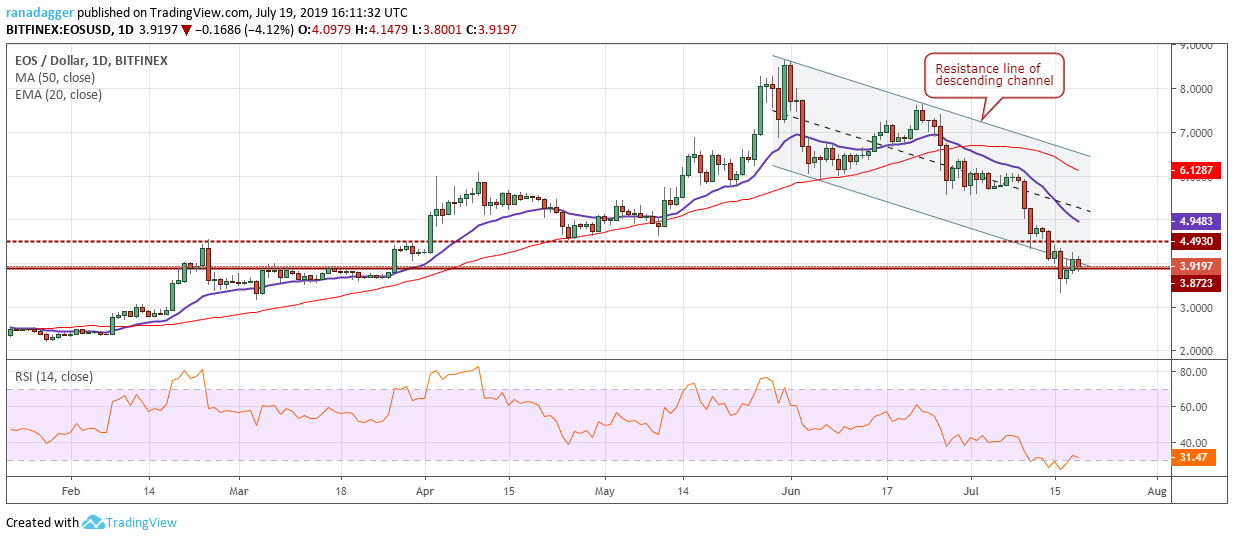
Though EOS climbed back above $3.8723, the bulls have not been able to ascend the next overhead resistance of $4.493. This shows muted demand at higher levels. Both moving averages are sloping down and the RSI is close to the oversold zone. This suggests that the bears are firmly in the driver’s seat.
If the EOS/USD pair breaks down of $3.30, it will resume its downtrend. There is a minor support at $3, below which a fall to $2.70 is likely. Conversely, if bulls succeed in pushing the price above $4.493 and the 20-day EMA, the pair can move up to the resistance line of the channel. We will wait for the price to stop falling and for buyers to return before recommending a long position in it.
BSV/USD
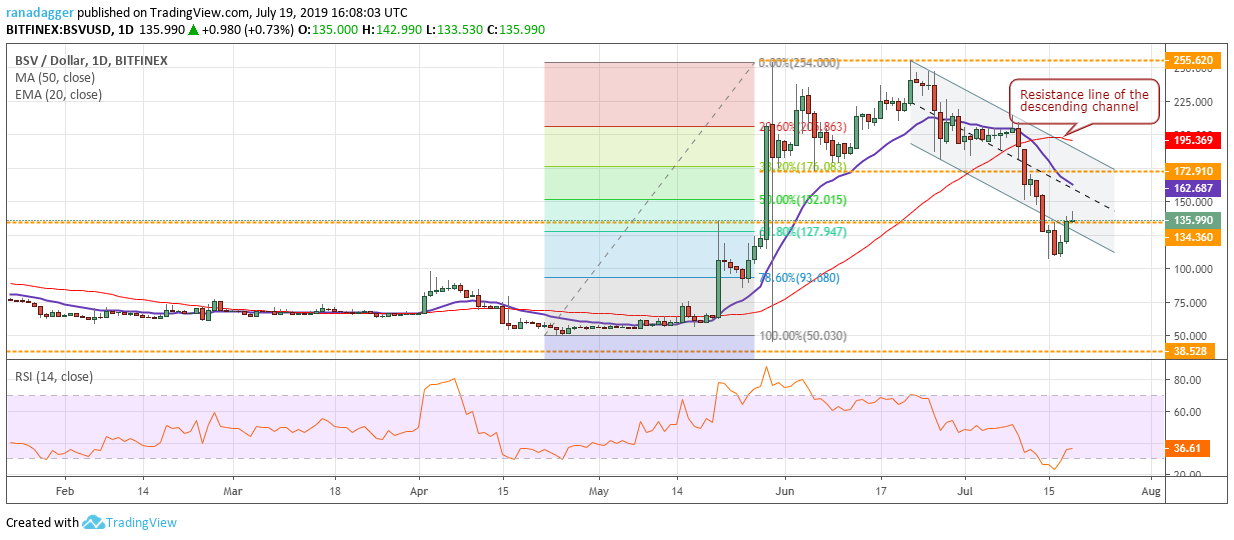
Bitcoin SV (BSV) bounced off from close to $107 and has re-entered the descending channel. It can now move up to the 20-day EMA, which will act as a resistance. If the price turns down from the 20-day EMA, bears will try to resume the downtrend by breaking down of $107. If successful, there is a minor support at $93.680, below which the fall can extend to $50.030. The downtrending 20-day EMA and RSI in the negative territory suggests that the bears have the upper hand.
Contrary to our assumption, if bulls push the price above 20-day EMA, the BSV/USD pair can move up to the resistance line of the channel. A breakout of the channel will signal strength. Until then, every pullback is likely to be sold into. We do not find any reliable buy setups at current levels, hence, we are not recommending a trade in it.
TRX/USD
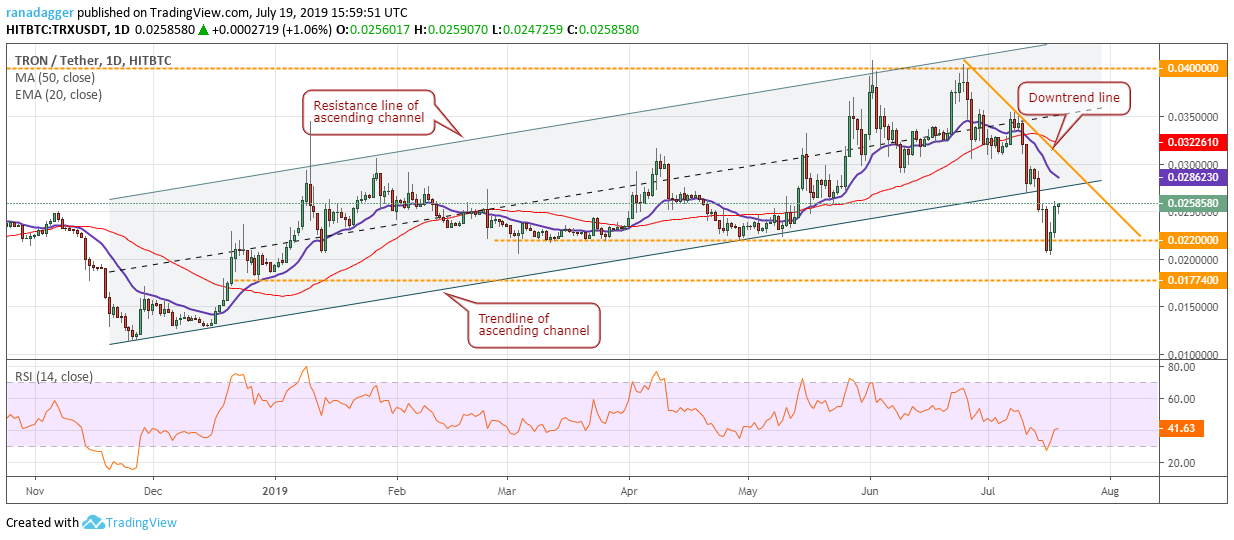
Tron (TRX) turned around from $0.0204 on July 17 and is currently retesting the breakdown level from the channel. We anticipate the bulls to face stiff resistance at the channel line and above it at the downtrend line.
If the TRX/USD pair re-enters the channel and breaks out of the downtrend line, it will indicate strong demand. However, if the pair reverses direction from one of the overhead resistances, it can again correct to $0.022.
The next drop towards $0.022 will give us a better idea on whether the correction has ended or not. Presently, the downsloping 20-day EMA and the RSI in the negative zone indicates that the path of least resistance is to the downside.
XLM/USD
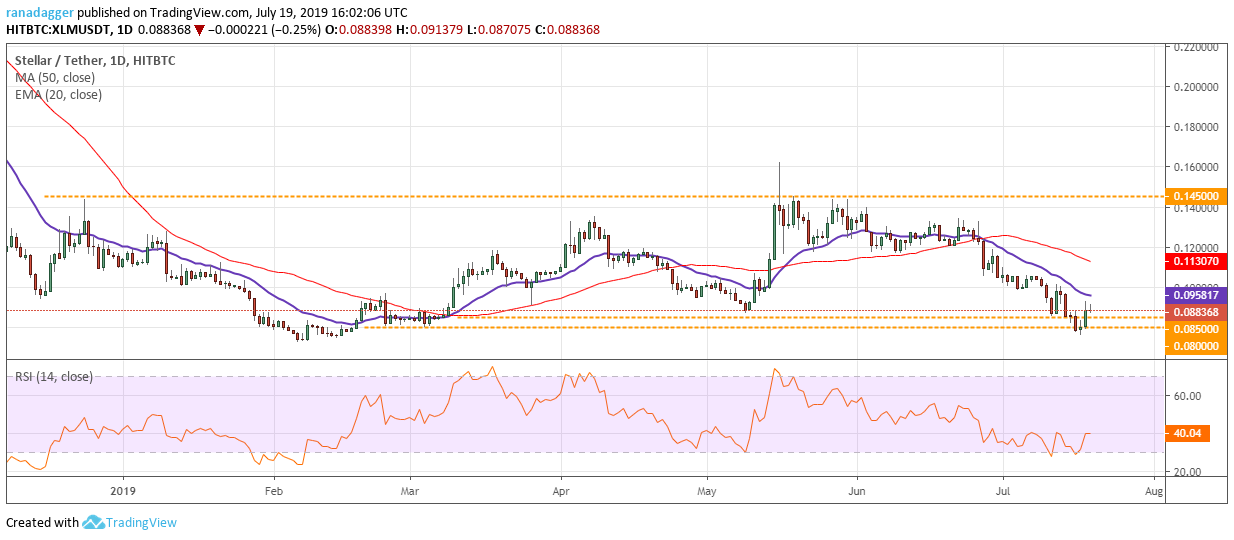
The bulls are attempting to keep Stellar (XLM) in the range but we anticipate strong selling close to the 20-day EMA. A breakout of this resistance will be a positive sign and will suggest that the cryptocurrency might trade inside the $0.080–$0.145 range.
But if the XLM/USD pair turns down and breaks below the recent low of $0.076, it can correct to $0.072545. A breakdown to new yearly lows will signal weakness and a lack of demand at lower levels. Currently, both the moving averages are sloping down and the RSI is in the negative territory. This shows that bears have the upper hand. We should see a strong directional move within the next few days.
Market data is provided by the HitBTC exchange.


