Bitcoin is getting ready for a large move. At what level does it become a buy? Let’s analyze the charts.
In the past few weeks, both Bitcoin and gold have attracted investors who have flocked to safe haven assets due to trade wars and an uncertain geopolitical environment. While traditional investors prefer investing in gold, the discovery of fake kilogram gold bars in the vault of JP Morgan Chase points to a forgery crisis. While gold owners need an expert to confirm the authenticity of their holding, Bitcoin node operators do not need any, which is a huge advantage.
The government has confiscated gold holdings of the public in the past, hence, there is a possibility that it can do it again if the economic situation worsens. However, decentralized digital currencies are not controlled by any government, hence, they offer greater protection of personal wealth compared to any other asset class during upheavals. After the recent anti-government protests in Hong Kong, businesses and individuals have switched to digital currencies, which shows how it is being preferred over fiat currencies.
While some analysts expect Bitcoin to drop from current levels, Nigel Green, the CEO and founder of financial consultancy firm deVere Group, believes that $10,000 is the new floor for it. What does the chart project? Let’s analyze.
BTC/USD
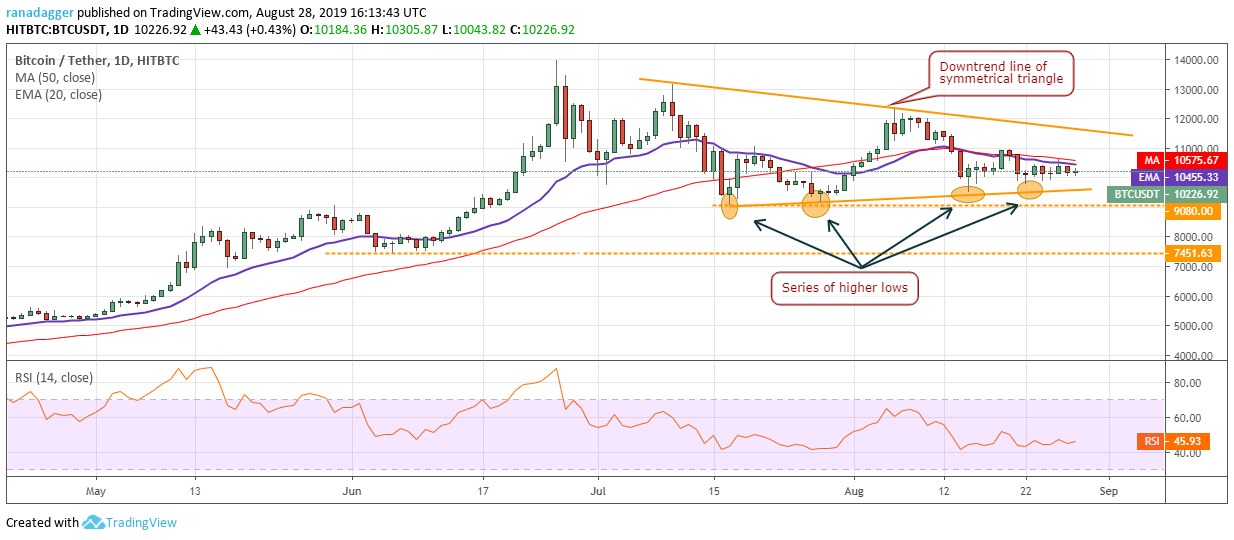
A period of trading in a small range is followed by range expansion, which usually results in a trending move for a few days. However, it is difficult to predict the direction of the breakout. The volatility in Bitcoin (BTC) has dropped sharply in the past few days. We anticipate a sharp move in either direction within the next few days.
A breakout of the moving averages can push the price to the downtrend line of the symmetrical triangle, above which the uptrend will resume. Traders can initiate long positions as recommended in our earlier analysis.
However, if bears sink the BTC/USD pair below the critical support of $9,080, a drop to $7,451.63 is possible. Both moving averages have flattened out and the RSI is just below 50, which points to a consolidation in the short term. As there is no clarity on the chart about the next likely direction, we do not suggest a buy at current levels.
ETH/USD
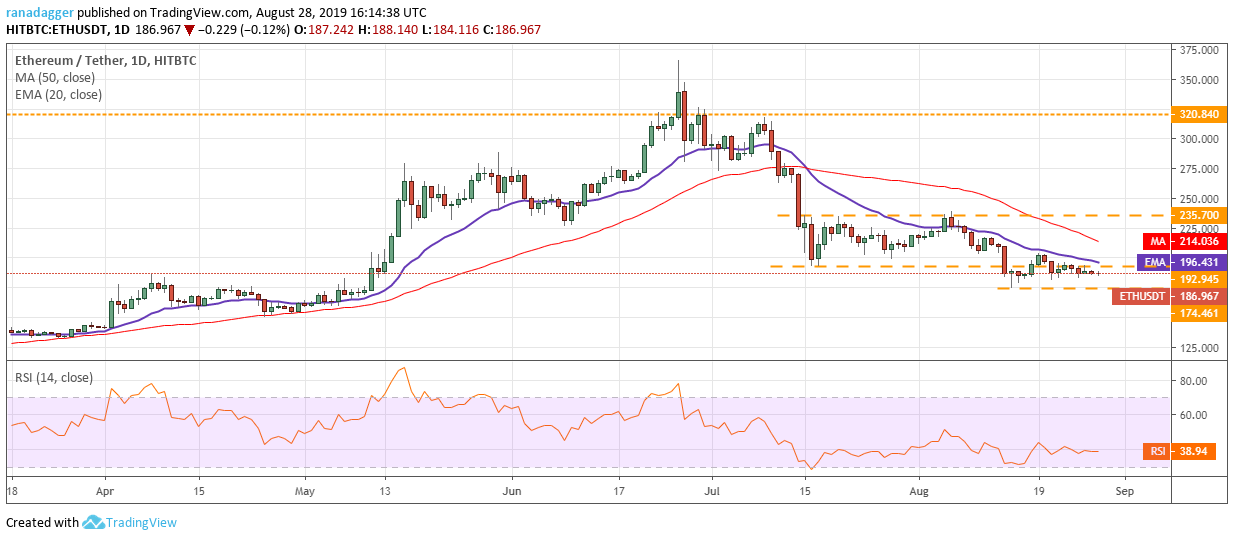
Ether (ETH) continues its lackluster trading in a tight range. Though it is quoting below the 20-day EMA, we like the way the bulls have kept the price close to the overhead resistance of $192.945.
If the ETH/USD pair rises above the 20-day EMA, it is likely to reach $235.70. Though there is minor resistance at the 50-day SMA, we expect it to be crossed. Therefore, we retain the buy recommendation given in our earlier analysis.
Conversely, if bulls fail to scale above the overhead resistance, bears will attempt to sink the pair below the critical support at $174.461. If this support cracks, the decline can extend to $150.
XRP/USD
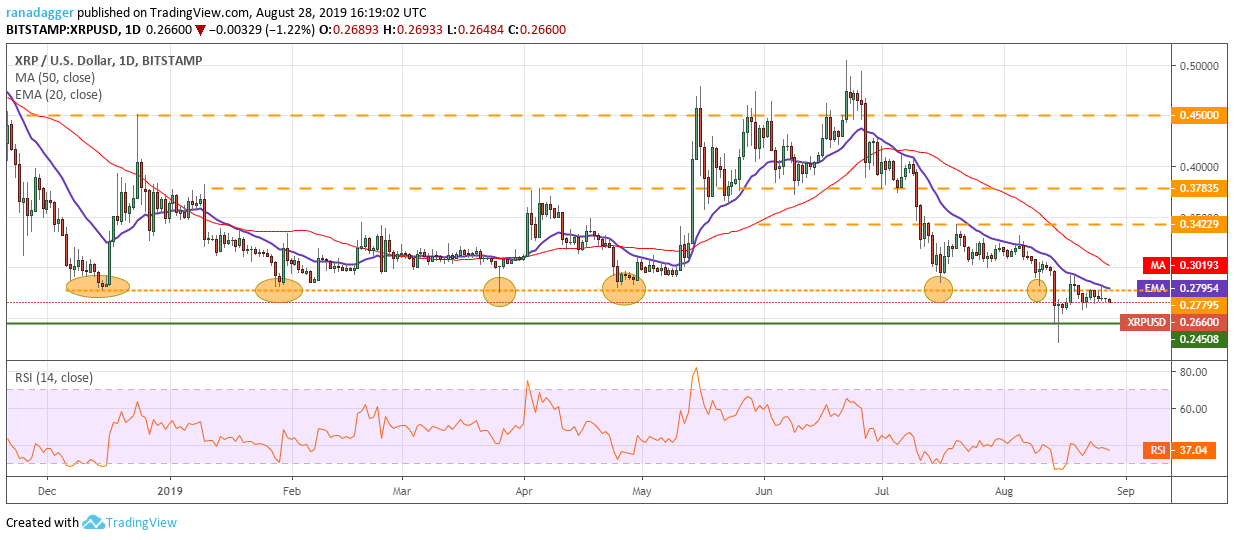
The failure to rise above the 20-day EMA has attracted selling. XRP is again likely to retest the support at $0.24508. If this support gives way, it can plummet to the yearly low of $0.225. With both moving averages trending down and the RSI in the negative zone, the advantage is with the bears.
Our negative view will be invalidated if the bulls defend the $0.225–$0.24508 support zone and push the price above the 20-day EMA. If the XRP/USD pair climbs above $0.27795, it will indicate that the breakdown on Aug. 15 was a bear trap. However, as the 20-day EMA has continued to slope down, we withdraw our buy recommendation given in an earlier analysis. We will give a new suggestion after the pair sustains above $0.27795.
BCH/USD
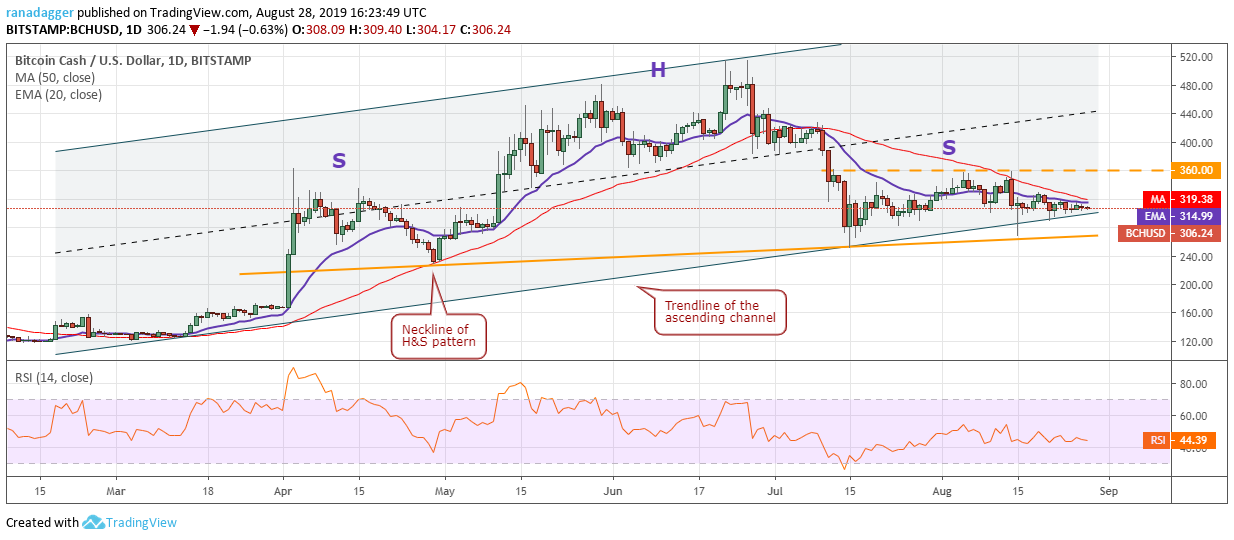
Bitcoin Cash (BCH) has been trading just above the trendline of the channel for the past few days. While the bears have failed to break below it, the bulls have failed to bounce off it. The 20-day EMA is flattening out and the RSI is just below the midpoint, which points to a range-bound action for a few days.
The BCH/USD pair will turn bearish on a breakdown and close (UTC time) below the neckline of the head-and-shoulders (H&S) pattern. Such a move will be a huge negative and can drag the pair to $166.98 and below it to $105.
Conversely, if the cryptocurrency rebounds off the trendline of the channel or from the neckline of the H&S pattern and rises above the moving averages, a rally to $360 is possible. A breakout above $360 can pick up momentum and push the price to $515.35. Currently, we do not find any trade in it.
LTC/USD
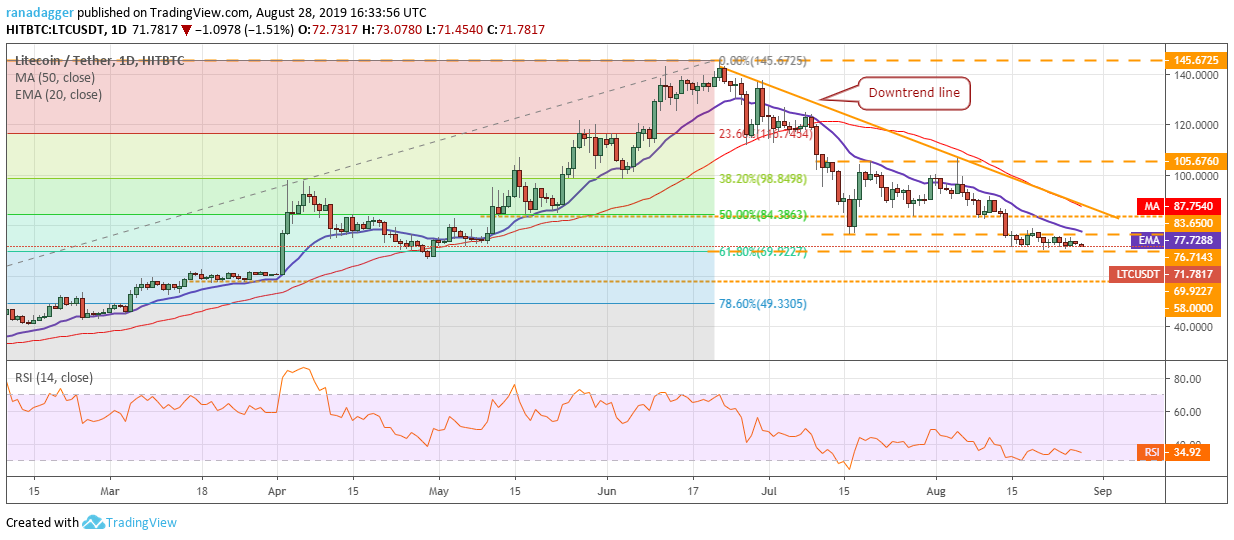
The failure to breakout of the 20-day EMA is likely to attract selling and Litecoin (LTC) might again retest the critical support at $69.9227. Both moving averages are sloping down and the RSI is in the negative zone, which suggests that the path of least resistance is to the downside.
If the LTC/USD pair dips below $69.9227, it can drop to the next support at $58 and below it to $49.3305, which is the 78.6% Fibonacci retracement level of the entire rally. Our bearish view will be invalidated if the pair rebounds sharply from current levels and rises above the downtrend line. Such a move will signal the start of a new trend. We will wait for a new buy setup to form before proposing a trade in it.
BNB/USD
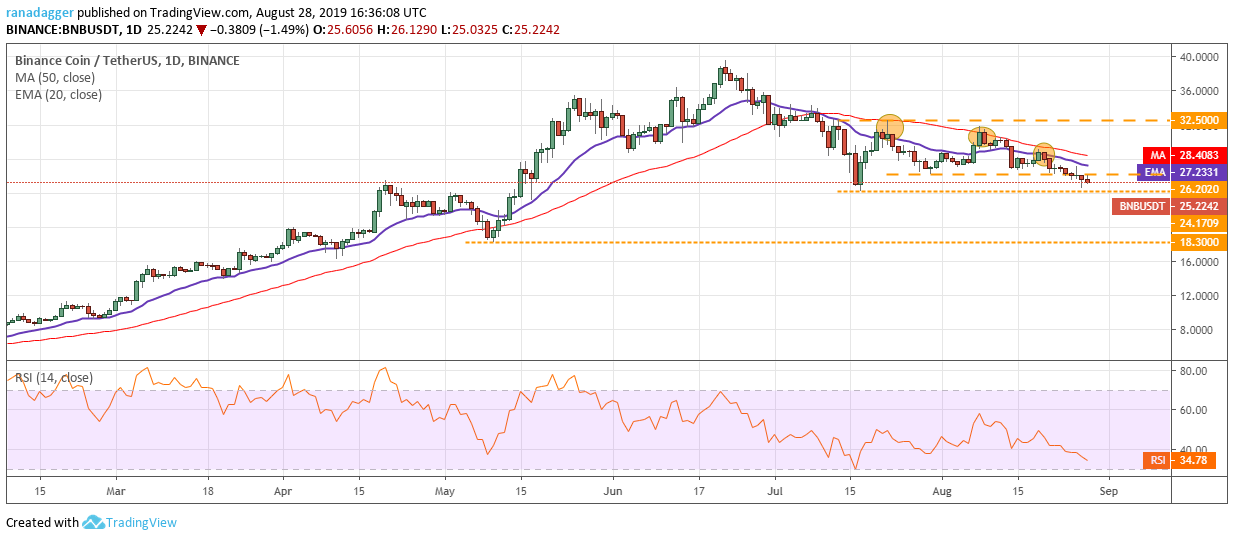
Binance Coin (BNB) held the support at $24.1709 on Aug. 27 but has failed to rebound sharply off it. This indicates a lack of demand even at strong support. If it does not climb above the 20-day EMA within the next few days, the probability of a breakdown of the support increases. This will dent sentiment and signal a change in trend. The next support on the downside is at $18.30.
With both moving averages sloping down and the RSI in negative territory, the advantage is with the bears. Notwithstanding, a strong rebound off $24.1709 will be a sign of accumulation by bulls. If the BNB/USD pair rises above the 50-day SMA, a rally to $32.50 is likely. We do not find a buy setup at current levels, hence, we are not proposing a trade in it.
EOS/USD
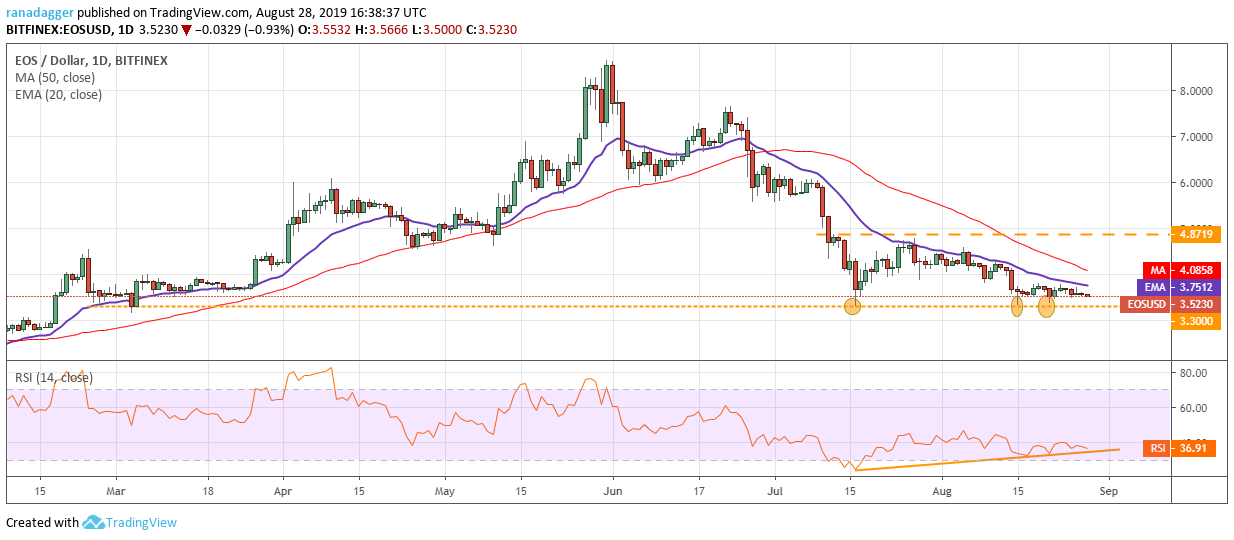
EOS has been gradually falling towards the critical support of $3.30. The downtrending moving averages and RSI in the negative territory suggest that bears have the upper hand. If the price breaks below $3.30, we anticipate further weakness and a fall to $2.76.
However, if the bulls again defend the support at $3.30 and the EOS/USD pair rebounds sharply, it can move up to $4.8719. Aggressive traders can utilize this short-term trading opportunity as suggested in our previous analysis. The RSI is also showing a bullish divergence, which is a positive sign.
BSV/USD
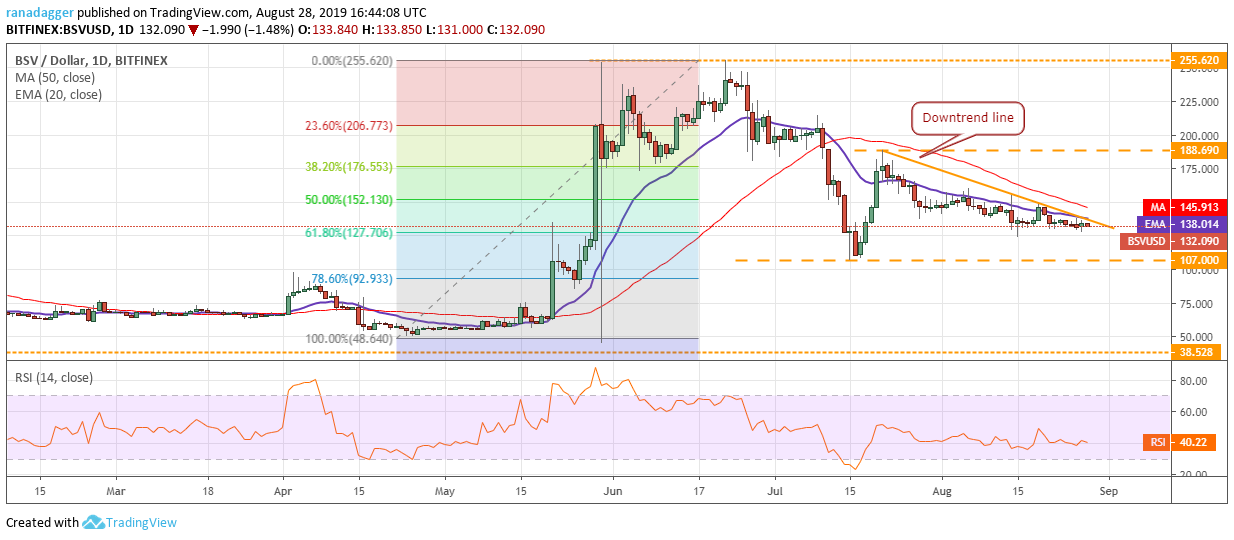
Bitcoin SV (BSV) continues to trade in a tight range, which shows a balance between buyers and sellers. If the range resolves to the downside and bears sink the price below $136, a drop to the critical support at $107 is probable. If this support also cracks, the cryptocurrency will become very negative and can drop to $85.338.
Conversely, if the BSV/USD pair turns around from current levels and scales above the 50-day SMA with strength, we expect buying to pick up. The next level to watch will be a move to $188.69. This can offer an opportunity for short-term traders. We will wait for the price to close (UTC time) above the 50-day SMA before proposing a trade in it.
XLM/USD
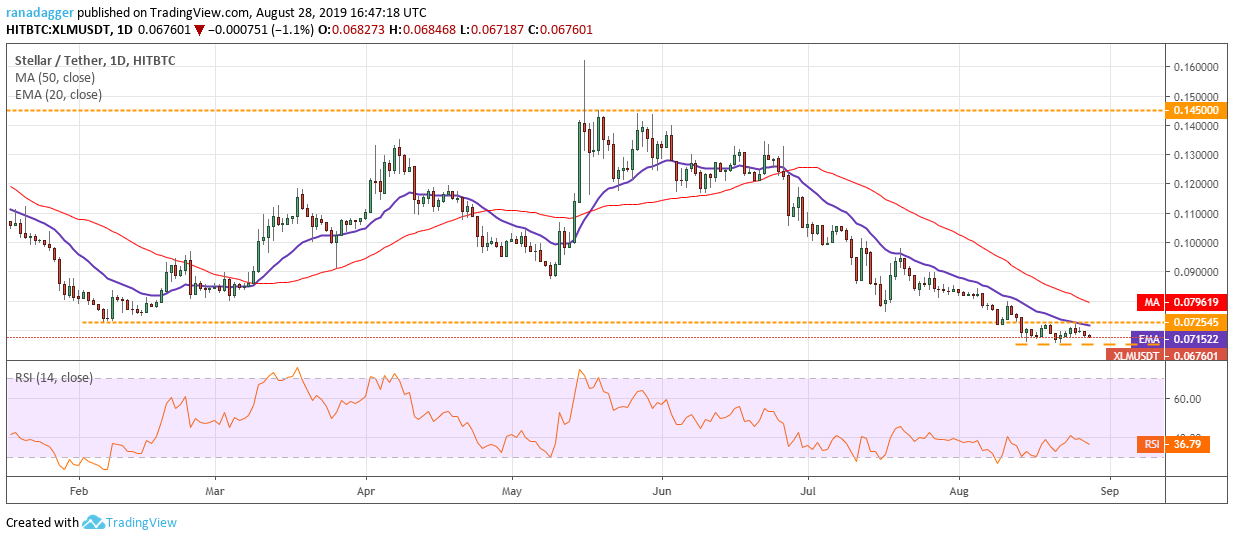
Stellar (XLM) has been consolidating in a tight range of $0.072545–$0.65 since Aug. 15. This indicates that both bulls and bears are undecided about the next directional move, hence, are not taking large bets. However, we do not expect this consolidation to continue for long. Soon, we should see the price escape the range.
The downsloping moving averages and the RSI in the negative zone suggest that bears have the upper hand. If the XLM/USD pair breaks down and closes (UTC time) below $0.065, it will resume the downtrend. The next level to watch on the downside is $0.05.
Conversely, if the pair breaks out of $0.072545, it is likely to attract buyers who have been waiting on the sidelines and the price can quickly move up to $0.097795. This can offer a low-risk buying opportunity Hence, traders can initiate long position on a close (UTC time) above $0.072545 and keep a stop loss at $0.065.
XMR/USD
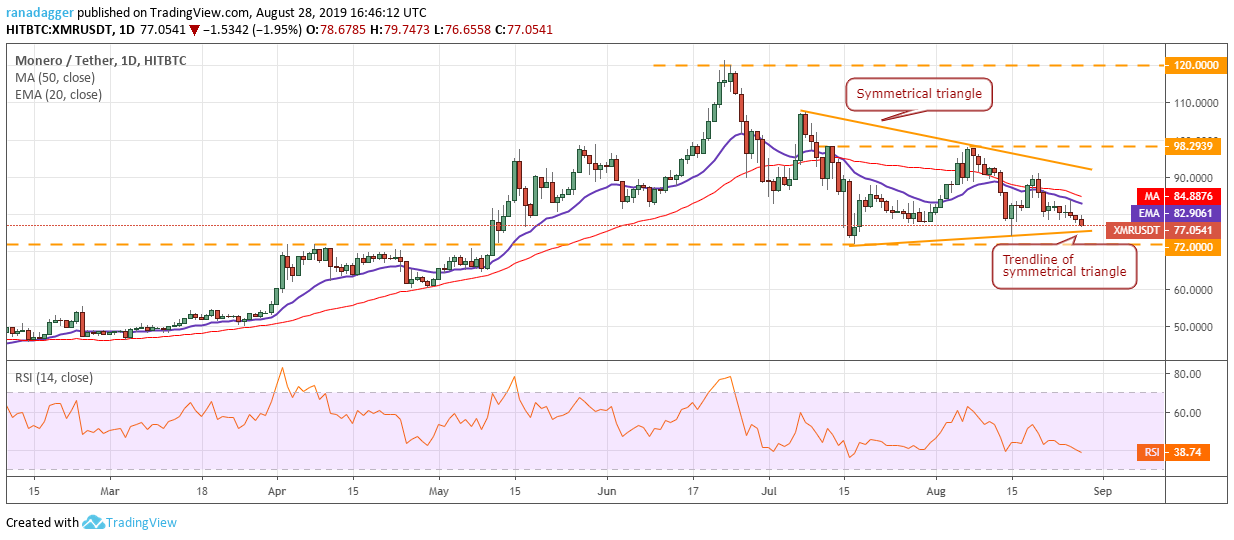
Monero (XMR) has been gradually drifting lower to the trendline of the symmetrical triangle. This shows a lack of buying interest by bulls. Both moving averages are sloping down and the RSI is in negative territory. This suggests that the path of least resistance is to the downside. If the price plunges below $72, a drop to $60 is probable.
However, if bears fail to break down of the triangle, bulls will attempt a recovery, which will gain strength above both moving averages. We expect the XMR/USD pair to resume its up-move on a breakout of the symmetrical triangle. Until then, we suggest traders remain on the sidelines.
The views and opinions expressed here are solely those of the author and do not necessarily reflect the views of Cointelegraph. Every investment and trading move involves risk. You should conduct your own research when making a decision.
Market data is provided by the HitBTC exchange.


