
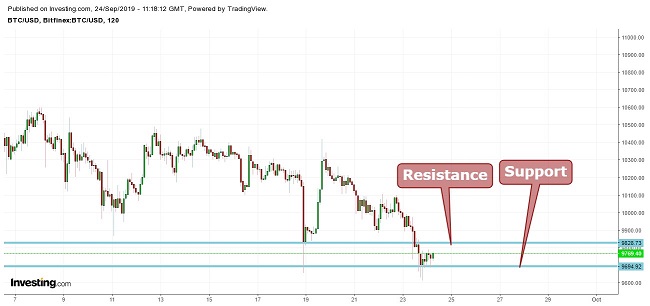
Bitcoin(BTC)trade is currently trading at $9,714. When looking at the chart below, we can see that the cryptocurrency price has recently broken the support of $9,828, turning it into resistance with a new support level at $9,695. The price has jumped up from the support level, which is a minor early indication of a positive momentum.
Dow Theory
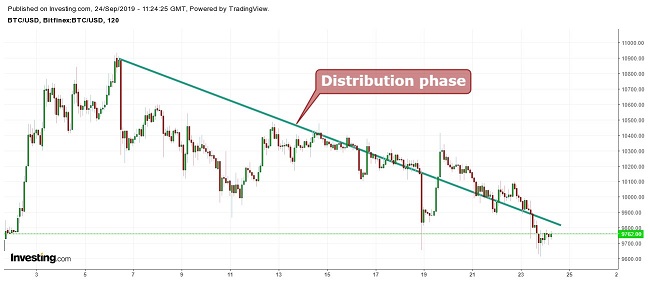
According to Dow Theory, the Bitcoin price is in the distribution phase, which starts after the public participation phase. During this phase the investors who took long positions during the accumulation phase begin to sell their positions.
Bollinger Bands
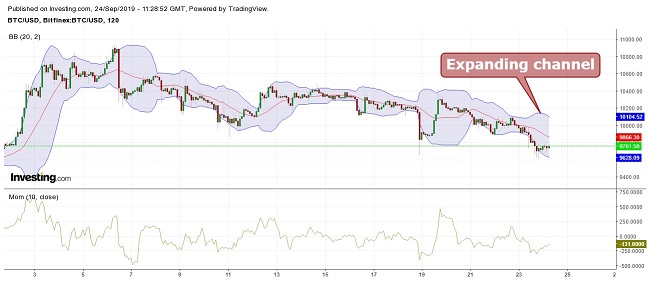
The BTC price is moving between the channels with the middle average line acting as resistance. The band is expanding, indicating increased volatility. The momentum is turning positive, which indicates that the price will move upwards and will soon enter the accumulation phase.
Moving Average
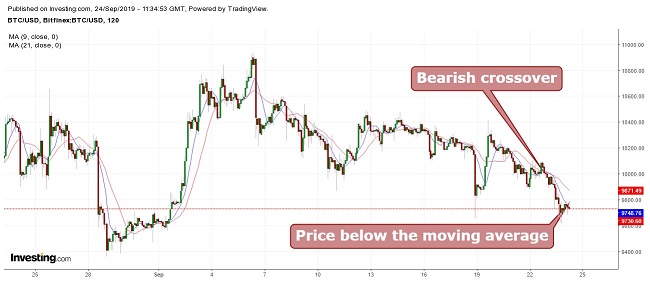
When taking 9 period moving averages (blue) with 21 period moving averages (red), a bearish crossover is seen. Bitcoin’s price is also moving below the moving averages, indicating a movement of correction. It is suggested to wait until the cryptocurreny price closes above the moving averages.

Conclusion
Bitcoin(BTC)trade is currently is trading at $9,714 with resistance at $9,828 and support at $9,695. For swing trading, long positions can be taken whilst keeping a target price at $9,810. Also for long positions, it is suggested to wait until the price closes above $9,830 with a target price at around $10,010.
Currently the price is in the distribution phase and can fall even further, as a close below $9,695 can drag the price down to $9,380. It is suggested to wait until the indicators become positive and price starts trading above the moving averages.
Pivot Points
| Name | S3 | S2 | S1 | Pivot Points | R1 | R2 | R3 |
| Classic | 8877.6 | 9266.3 | 9639.6 | 10028.3 | 10401.6 | 10790.3 | 11163.6 |
| Fibonacci | 9266.3 | 9557.4 | 9737.2 | 10028.3 | 10319.4 | 10499.2 | 10790.3 |
| Camarilla | 9803.5 | 9873.3 | 9943.1 | 10028.3 | 10082.9 | 10152.7 | 10222.5 |
| Woodie’s | 8870.0 | 9262.5 | 9632.0 | 10024.5 | 10394.0 | 10786.5 | 11156.0 |
Technical Indicators
| Name | Value | Action |
| RSI(14) | 55.445 | Buy |
| STOCH(9,6) | 26.226 | Sell |
| STOCHRSI(14) | 0.000 | Oversold |
| MACD(12,26) | 932.700 | Buy |
| ADX(14) | 37.197 | Buy |
| Williams %R | -85.837 | Oversold |
| CCI(14) | -87.2566 | Sell |
| ATR(14) | 1673.0683 | Less Volatility |
| Highs/Lows(14) | 0.0000 | Neutral |
| Ultimate Oscillator | 45.150 | Sell |
| ROC | -9.099 | Sell |
| Bull/Bear Power(13) | -9.8196 | Sell |

If You Liked This Article Click To Share