Bitcoin (BTC) finished a volatile week at $8,282 which is a 5% increase for the week but still 6% away from the highs of over $8,800. This morning, Bitcoin took another knock at opening, trading slightly lower alongside the rest of the cryptocurrency market and traditional markets.
XRP has thus far bucked the trend and is up 3% at the time of writing. With Bitcoin’s move out of the consolidation being hammered back last week, we will take a look at what may have been behind the rejection and what is likely to happen this week.
Daily crypto market data. Source: Coin360
BTC USD weekly chart. Source: TradingView
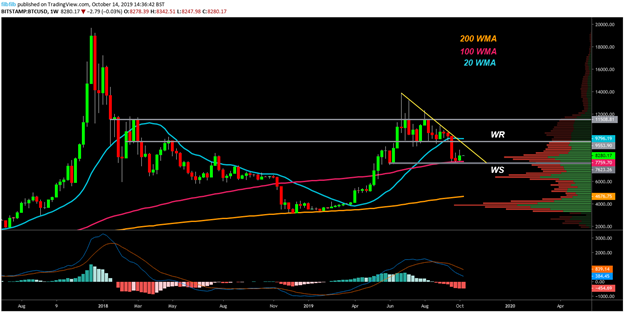
Bitcoin price was strongly supported by the 100 week moving average (WMA) which bounced the price back up towards $9,000 last week, before falling short of both the $9k handle and the major resistance at $9,500. There are now clearly defined battle lines drawn, with Bitcoin sitting closer to the lows of the weekly support rather than towards the highs.
On a macro level, while continuing to trade below the 20 WMA, Bitcoin favours the bears medium term with the 100 WMA being the last line of defence. The Moving Average Convergence Divergence (MACD) shows momentum continues to favour the downside although the histogram is showing signs of flattening out.
The present trading range around $8,000 is of relatively high volume interest as shown by the high Volume Profile Visible Range (VPVR) node down the right hand side of the chart which shows the amount of volume traded at a given price.
If this level fails to hold, the next stop is likely to be the mid to low $6,000s with the 200 WMA being the last line of defense in the mid $4,000s.
Generally, the lower time frames are more useful in helping to identify what is most likely to occur over the next few weeks.
BTC USD daily chart. Source: TradingView
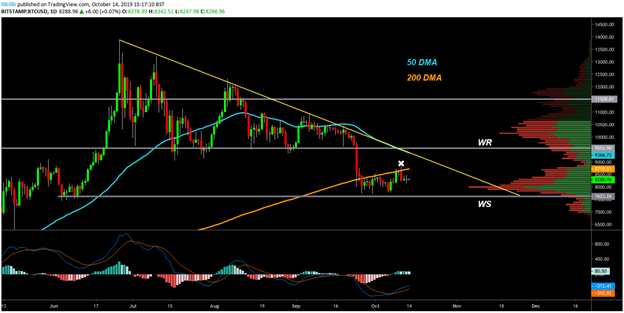
A closer look at the daily chart reveals that Bitcoin is clearly being held back by the 200 DMA having broken out of a fairly well established trading range between $7,800 and $8,500. Bitcoin also briefly tested and broke through the 200 DMA before being smacked back down below $8,500.
The looming concern for bulls is the so called death cross of the 50 and 200 DMA which is on track to occur before the end of the month. The MACD is trending upwards but the histogram shows that the trend is not particularly strong, which implies that there is not much momentum to break the cluster of resistance overhead.
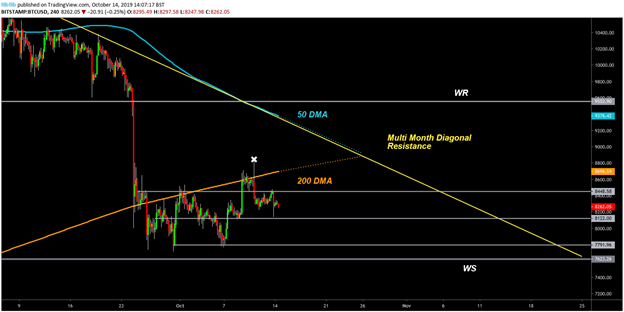
BTC USD 4-hour chart. Source: TradingView
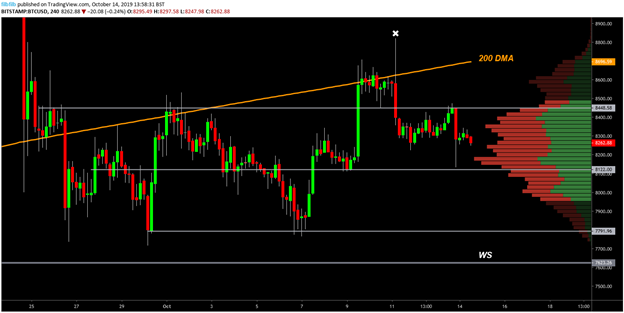
The 4 hour Bitcoin chart clearly shows the rejection at the 200 DMA off the back of a strong bounce back into the range of $8150 – $8450 where the majority of buying and selling interest exists.
The bulls will need to maintain the upper 50% of the range and defend the $8,150 level to generate enough momentum to retest the rising 200 DMA which will be critical in the next couple of weeks. Another retest of the 200 DMA would imply that it could be weakening as a point of resistance so this would be an interesting development.
Bullish case
The 200 DMA is rising rapidly and continues to be an area which the bulls want to test. The chart shows that a higher high and a higher low were put in last week which is also a bullish sign. Another test of the rapidly rising 200 DMA could be in store should the bulls maintain the $8,150 level.
The VPVR illustrates that there is not a lot of volume in the $9,000 range so a push to this level could result in a similarly fast move to that which was seen on the way down and is somewhat reminiscent of the volume void above $4,000 earlier in the year.
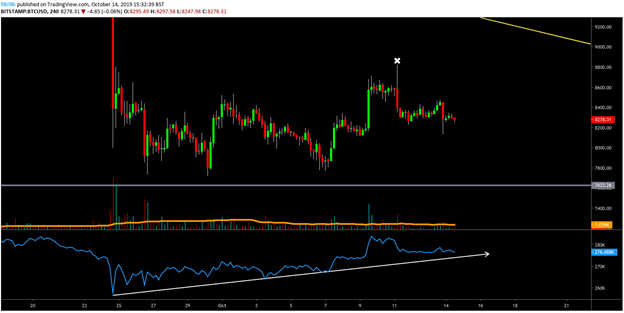
Bitcoin’s On Balance Volume indicator (OBV) on the 4 hour chart continues to show that the cumulative buying volume is outweighing that of the selling volume within this consolidation period. This is atypical of an accumulation period.
BTC USD 4-hour chart. Source: TradingView
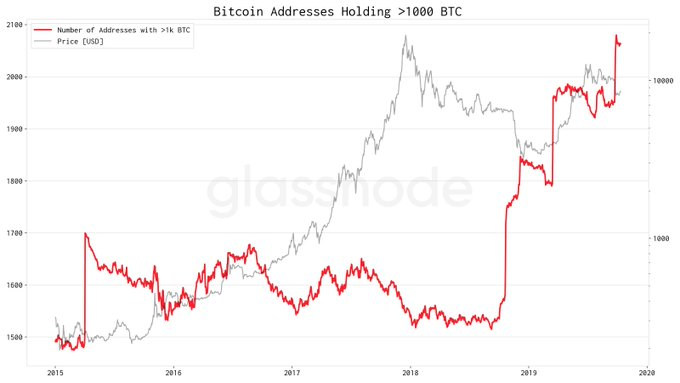
This idea is somewhat supported by data from Glassnode and the findings shows a large increase in the number of Bitcoin wallets holding 1000 BTC or more.
Bitcoin Addresses Holding > 1000 BTC. Source: Glassnode.com
The data interestingly shows that since Q4 2018, there have been significant increases in this metric which were unseen in the 2017 bull market. This implies that high net worth individuals and possibly institutions are accumulating rather than retail speculators.
Furthermore, there was largely sideways action in this metric once Bitcoin hit $9,000 on the way up during 2019 with some small profit taking visibly took place. It should be noted that since the breakdown from $10,000, there has been around a 10% increase in the number of wallets with large volume holdings.
The majority of these coins were accumulated with a lower average cost than current prices, likely holding an average somewhere in the $5,000 range. Therefore, it seems unlikely that they will be on the brink of capitulation anytime soon and are taking this price decline as an opportunity to acquire more market exposure
This is a positive sign for the bulls given that there has been no obvious accumulation spike since the one which preceded the break from $4,000 to 5,000, meaning that there is interest again from big players. On the flip side, the accumulation began in Q4 2018, following a significant sell off to the low $3,000s.
The conclusion here is that there is buying interest again in this range, but it does not mean that it will prop up Bitcoin’s price. Any further liquidity offered by another decline Is likely to be met with similar buying interest.
Bearish scenario
Despite the accumulation narrative being strong, it bears little impact on the impending issue in the market, which is the convergence of the 50 and 200 DMA which are on track to meet by the final week of October. The 50 DMA is also tracking the diagonal resistance which has now held Bitcoin down for several months.
BTC USD 4-hour chart. Source: TradingView
Failure to break through this convergence of resistance would see calls for this move to be bear flag or ascending wedge and this would open the door to the $6,000 level. A failure to respond here would then open the door to retesting the 200 DMA and any trading below this point might induce calls for a prolonged bear market.
Looking forward
Overall, there are signs that buyers are looking for opportunities with big players becoming very interested in the retracement from the 2019 high. Maintaining price above $8,000 and another retest of the quickly rising 200 DMA is the main task for the bulls.
Currently, the bears are looking to take advantage of any signs of weakness if prices dip below $8,000. There is around 2 weeks remaining at the most before this market makes a definitive move for Q4 2019.
The views and opinions expressed here are solely those of the author and do not necessarily reflect the views of Cointelegraph. Every investment and trading move involves risk. You should conduct your own research when making a decision.


