Ripple Price Key Highlights
- Ripple price has completed its retest of a former resistance level, which has held as support.
- Price could be due to climb to the Fibonacci extension levels, but it has yet to break out of this short-term triangle.
- Technical indicators are showing mixed signals on the direction of price action from here.
Ripple price appears to be gaining bullish traction but has yet to break out of a short-term symmetrical triangle.
Technical Indicators Signals
The 100 SMA is above the longer-term 200 SMA to indicate that the path of least resistance is to the upside. In other words, the uptrend is more likely to resume than to reverse. The 100 SMA is holding as dynamic support as well.
RSI is turning lower, however, suggesting that selling pressure is returning. Stochastic is also on the move down to indicate that bears have the upper hand, which indicates that there’s also a pretty good chance of a downside break. The pattern is around 0.0400 tall so the resulting breakout in either direction could be of the same height.
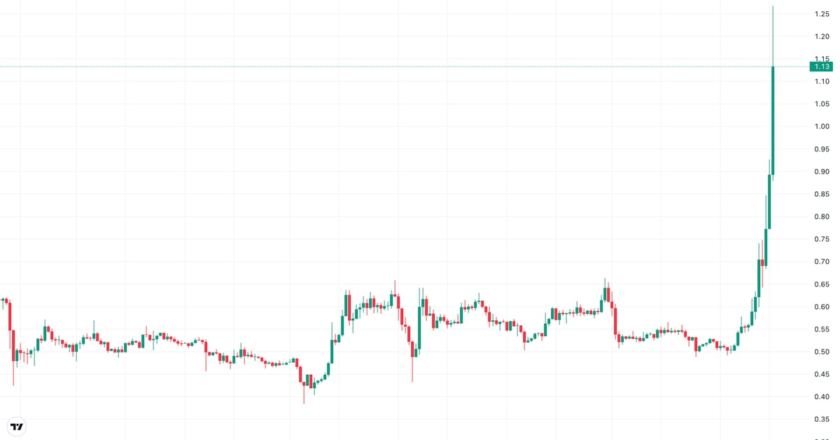
XRPUSD Chart from TradingView
If bullish pressure is sustained, Ripple price could also aim for the swing high near the 50% Fibonacci extension of 0.3800. Stronger momentum could take it up to the 61.8% extension at 0.3920 or the 78.6% extension at 0.4129. The full extension is located at 0.4395.
Ripple had a run of positive developments last week, including the three new exchange partners of its cross-border payments product xRapid. This could bring more liquidity and increased activity for this particular digital asset, which could then keep its value afloat.
According to Cory Johnson, Chief Market Strategist at Ripple:
“We’ve seen several successful xRapid pilots already, and as we move the product from beta to production later this year, these exchange partners will allow us to provide financial institutions with the comfort and assurance that their payments will move seamlessly between different currencies.”


