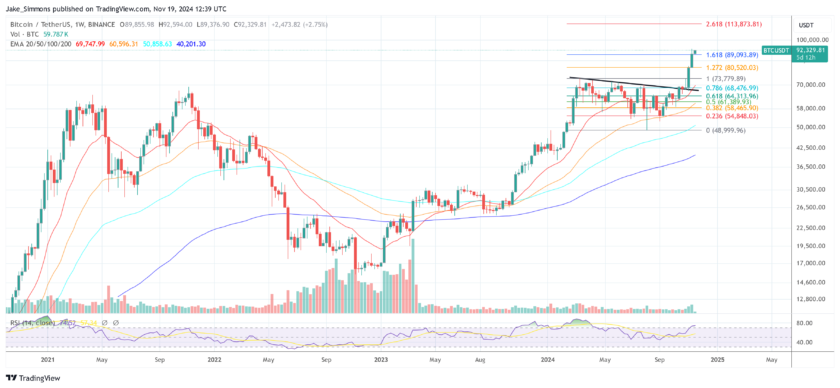
Bitcoin Price Key Highlights
- Bitcoin price broke below its ascending triangle consolidation to signal that more losses are in the cards.
- Price is finding a bit of support, though, so a pullback may be taking place from here.
- The Fibonacci retracement tool shows the next potential resistance levels, but technical indicators are signaling more gains.
Bitcoin price made a downside break from its triangle pattern and looks ready for a pullback before heading further down.
Technical Indicators Signals
The 100 SMA is above the longer-term 200 SMA to indicate that the path of least resistance is to the upside. In other words, there’s still a chance for the uptrend to resume and price to move back inside the triangle pattern.
However, the 200 SMA lines up with the 38.2% Fib at $6,360.50 to add to its strength as resistance and the 100 SMA coincides with the 61.8% Fib at $6,436.90. This is also near the broken triangle support, which might hold as resistance from here. A move past this level could lead to another test of the resistance at the swing high.
RSI already made it to oversold territory and is pulling back up to signal that buyers are returning while sellers take a break. Stochastic is also heading up to indicate a return in bullish momentum.
BTCUSD Chart from TradingView
Market Factors
Bitcoin price seems to be shedding its gains due to the improvement in risk appetite in global financial markets. The economic turmoil in Turkey is taking the backseat to the upcoming trade talks between the US and China, which many traders are hoping to get positive updates from.
One thing to keep in mind, though, is these are just low-level talks and there’s a low likelihood of any decisions being made. Worsening trade tensions could even lead to a return in risk aversion and dollar weakness, which might revive demand for bitcoin. Escalating troubles in Turkey could also boost bitcoin demand as people look for an alternative store of value.
If You Liked This Article Click To Share


