Bitcoin price (BTC) closed the week at $9,207, down 3.66%. Despite a surprisingly low volatility weekend, the bulls helped keep Bitcoin price above $9,000 for 10 days and at the time of writing the price continues to consolidate.
So far Monday has brought a move higher to retest $9,300, representing a 1% gain. EOS (EOS) and Ether (ETH) have had notable gains on the day with EOS trading over $3.50 and Ethereum at $185. The total crypto market cap is $249 billion, with Bitcoin dominance at 67.2%
Cryptocurrency market daily view. Source: Coin360
BTC USD weekly chart. Source: TradingView
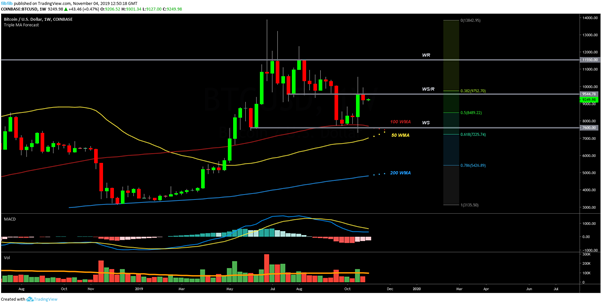
Bitcoin closed the week below the well-established prior support at $9,550 having previously found support at a previous weekly support level at $7,600 and the 100-week moving average (WMA).
The move to retest and briefly break resistance has now seen consolidation with the MACD line flattening above zero, illustrating the decline in bearish momentum. Volume returned to lower levels last week as the price consolidated in preparation for a larger movement which will most likely either send Bitcoin to retest previous weekly resistance at $11,500 or retrace back to find demand at lower prices.
BTC USD daily chart. Source: TradingView
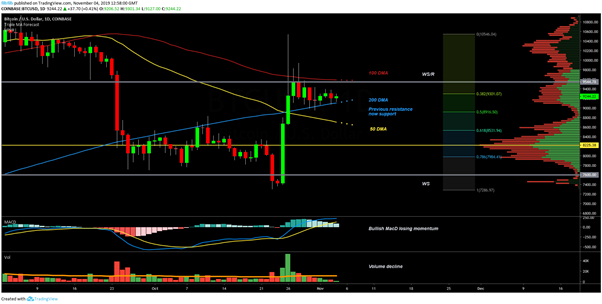
Today, Bitcoin has continued to find support at the 200-day moving average (DMA), which has been supporting the price since it was broken as resistance. The 100-DMA is now acting as resistance at $9,550, a point which is also a weekly resistance.
The pinch between these moving averages is an area of interest to follow as a daily close above or below these key averages could indicate the next direction for Bitcoin price. A breakdown could see the 50-WMA act as a support, which is currently around $8,500 and the 61.8% retracement level where there is likely to be buying interest.
The moving average convergence divergence (MACD) shows declining bullish momentum but this is not a surprise given the size of the previous move. Despite the decline in the volatility to the upside, the MACD itself continues to trend higher.
Trading volume has seen a significant decline, which is normally implicit of a bigger move brewing with breakout traders waiting to apply pressure once the inevitable move occurs. The point of control in the range is back at $8,200 where there has been the most price action.
Bitcoin price is tightening up
BTC USD 4-hour chart. Source: TradingView
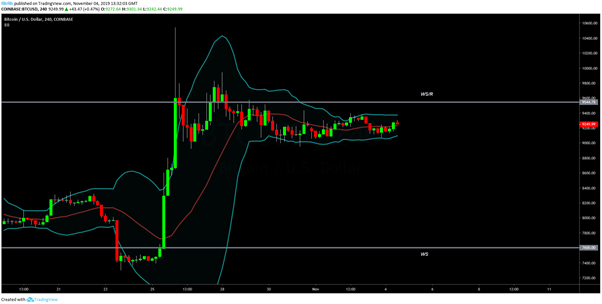
With Bitcoin trapped between key moving averages and below weekly resistance on the daily chart, the 4-hour chart Bollinger Bands clearly shows the extent of the tightening on price action.
The bulls are currently pushing the price across the 20-period moving average, which is a bullish sign. Notably, the price is essentially ranging between highs of $9,350 and lows of $9,050. A significant move is seemingly imminent so we will examine the bullish and bearish case.
Bullish case
BTC USD 4-hour chart. Source: TradingView
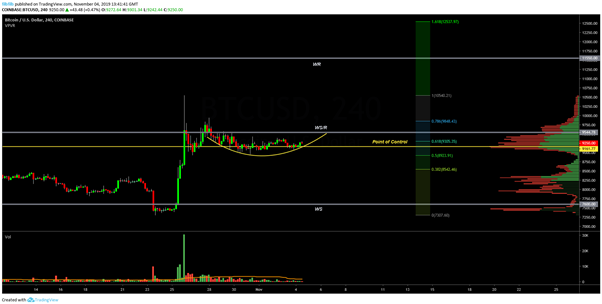
The bullish case for Bitcoin is that the bulls have maintained support over $9,000 for 10 days and price action is forming a rounding bottom which can be seen as a sign of continuation to the upside when in a bullish move. Occurring just below resistance might imply that the bulls are starting to push the price back to retest the weekly resistance at $9,550.
If Bitcoin can reclaim $9,550 and turn it into support, it may be an early sign that the digital asset is ready to continue higher. Due to the size of the previous movement, a measured rally higher might include Bitcoin quickly retesting previous resistance at $11,500 and possibly moving higher.
While seemingly a tall order, the most recent breaks above $10,000 saw Bitcoin move sharply higher. A quick move to $12,500 would not be out of the question if there is a significant short squeeze combined with fear of missing out invoked buying.
Bearish case
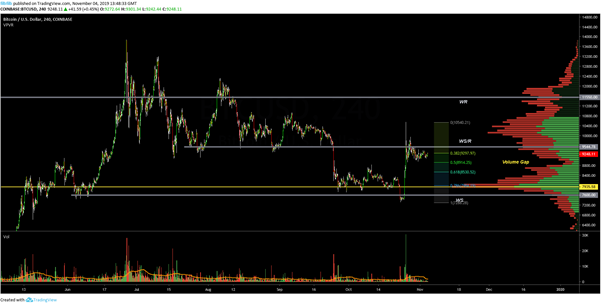
The bearish case for Bitcoin suggests that the sharp rejection seen when the price briefly crossed $10,000, could imply that the bulls are not done accumulating below. There is a clear void in volume price action between $10,000 and $8,000 which may require more time to be tested. This would not be a bad thing for a medium-term bullish case for Bitcoin.
The huge 4-hour volume spike shows that Bitcoin has made a significant change in sentiment, but a retest of previous support should not be ruled out after five months of bearish pressure.
The VPVR implies that sustained bearish pressure on $9,000 would most likely see a move back to the 61.8% retracement level in the mid 8,000s.
BTC USD 4-hour chart. Source: TradingView
With the battle lines tightening and the bulls pushing early on Monday, eyes will be on the critical weekly resistance level at $9,550. A decisive move is likely to occur in the next few days with the potential to the upside being significant. Any retracement is likely to see the price return to the $8,000 level again for some time.
The views and opinions expressed here are solely those of the author and do not necessarily reflect the views of Cointelegraph. Every investment and trading move involves risk. You should conduct your own research when making a decision.


