Bitcoin opened on a faint note this Monday as the market showed a lack of sense of direction owing to low volatility.
The world’s leading cryptocurrency was trading at around $7,575.27 as of 1429 UTC after rising by 0.8 percent since the market open. The move upside brought the asset’s net month-to-date gains up by 0.4 percent.
It additionally revealed traders’ fear of making big moves after bitcoin established its seven-month low in November, followed by an alarming pump-and-dump behavior on spot exchanges in the first week of December.
The situation has brought bitcoin closer to the possibility of undergoing further breakdowns. The price has rejected advances above the $14,000 level settled earlier this year. It is now under by more than 50 percent and continues to make fresh declines in a giant descending channel.
Strong Price Ceiling
The cryptocurrency’s near-term rallies have met rejection near the upper trendline of the Channel. The price briefly tested levels near $13,500, $12,000, and $10,500 since July but failed to transform the upsides into full-fledged breakouts.
Meanwhile, it kept on establishing fresher lower lows, the last one towards $6,526, indicating that traders have not found a strong bitcoin accumulation area yet.
Bitcoin is trending inside a medium-term descending channel | Source: TradingView.com
In the chart above, the price is evidently struggling to register fresh gains above the purpled area, which has earlier served as support to bitcoin’s bounce-back attempts.
A strong price ceiling is gravitating the price towards the redded area, defined by pivot support of $6,000 – a level known for behaving as a psychological barrier to both bears and bulls in the 2018-19 trading period.
Interim Structure Also Targets $6,000-Support
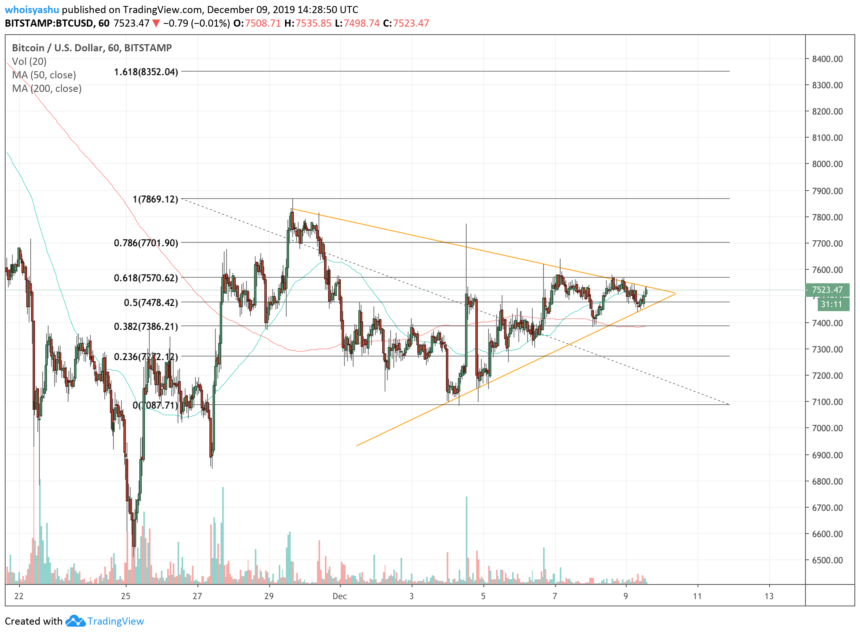
Over the last ten days, bitcoin is fluctuating inside what appears to be a Symmetrical Triangle. Two converging trendlines are creating a string of peaks and troughs, moving forward at a roughly similar slope. The height of the Triangle is close to $800, which means its breakout should result in a price move of – at least – equal proportions, in either direction.

Bitcoin getting closer to the apex of its interim symmetrical triangle | Source: TradingView.com, BitStamp
With volumes going down and bitcoin inching towards the apex of the Triangle, there is a strong likelihood of a breakout in the direction of the previous trend. Such a move could crash bitcoin towards the $6,000-$6,500 area.
Trading the Bearish Setup
An initial short position towards the $6,500 level from around the current market price looks ideal. From a risk management point of view, maintaining a stop-loss order above the Triangle at $7,570 is recommended. Breaking below $6.5K could have traders extend their positions towards $6,000.
Looking to the upside, a long entry towards $7,700 could promise small yet decent returns while preserving its risk with a stop-loss near the Triangle support makes sense.
Featured image from Shutterstock


