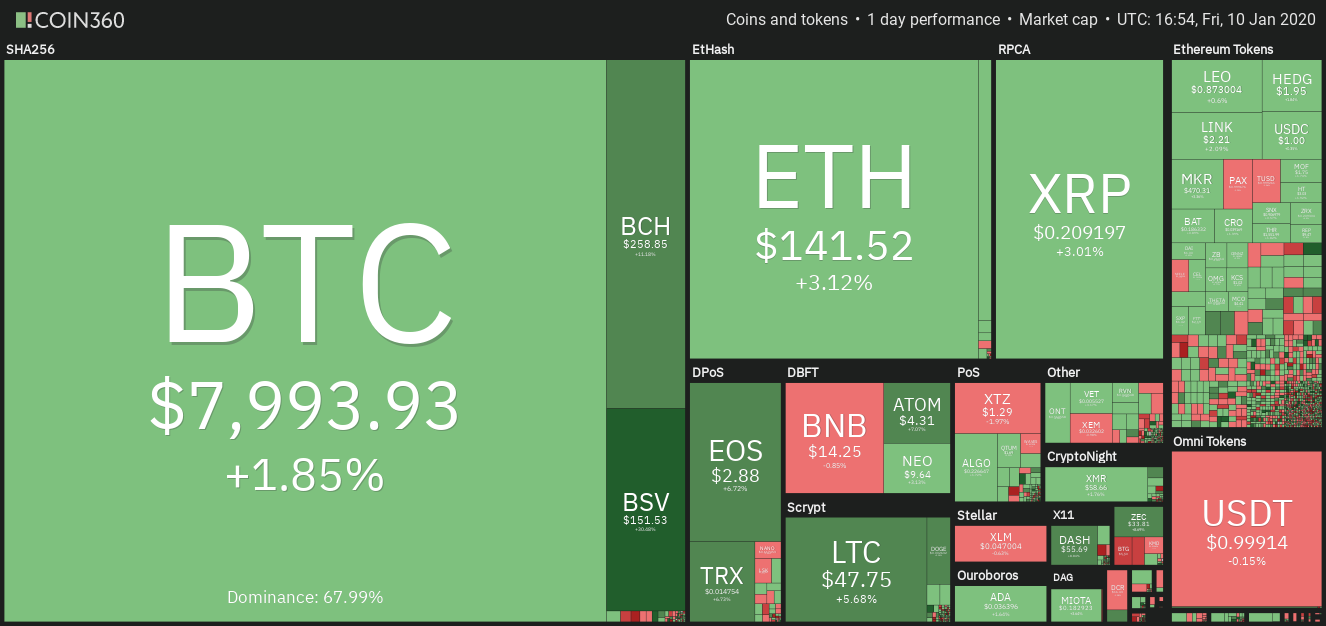
The bounce off the first support levels on most major cryptocurrencies indicates a possible change in trend.
Safe haven assets were dumped on Jan. 8, on reports that the US-Iran conflict might not escalate to an all out war. Cryptocurrencies, which had surged alongside gold and oil with also retreated from two-month high. However, the positive sign is that most major cryptocurrencies have held their immediate support levels, which indicates buying on dips. This shows that the sentiment has changed from sell on rallies to buy on dips.
With the news-based rally out of the way, the focus will again shift to the fundamentals. A new law governing cryptographic password management came into force in China on Jan. 1 and some local media outlets have speculated that this law was enacted as a safeguard for the forthcoming release of China’s central bank digital currency (CBDC).
Daily cryptocurrency market performance. Source: Coin360
Christine Lagarde, the president of the European Central Bank (ECB), also said that the bank is reviewing the merits of issuing a CBDC to cater to the urgent need for fast and low-cost payments. This shows that the ECB might be close on the heels of China in terms of launching a CBDC, which is a huge positive.
BitPay chief commercial officer Sonny Singh believes that “unforeseen” events could propel Bitcoin to a new high during this year. While analysts have been positive for 2020, let’s see if Bitcoin and the other major altcoins show signs of having bottomed out.
BTC/USD
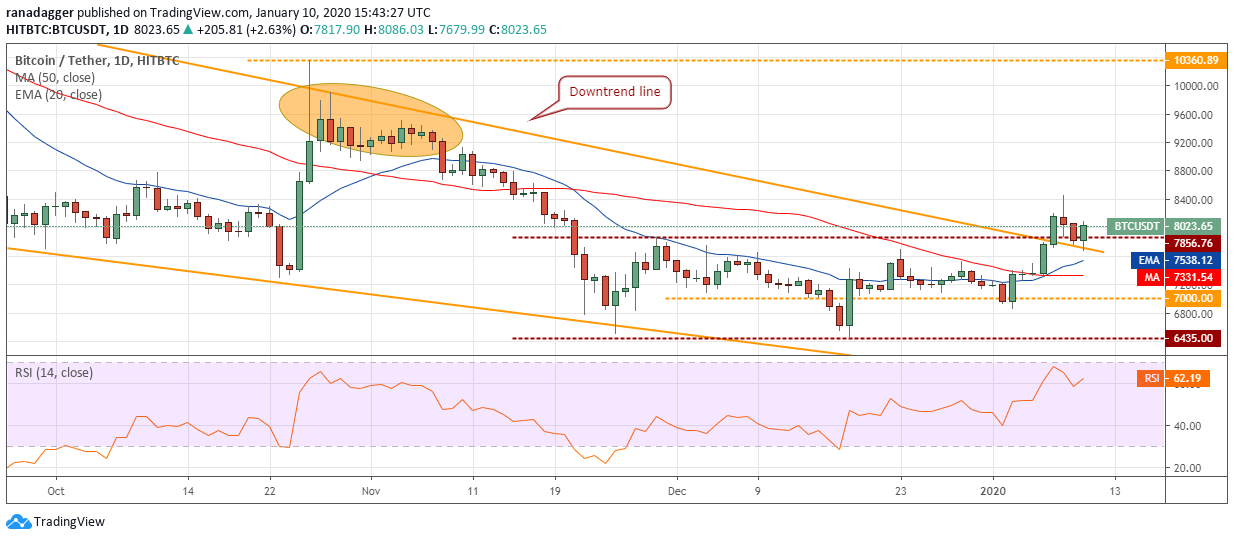
Bitcoin (BTC) turned down from $8,452.84 on Jan. 8. However, the pullback was short lived as the price is attempting to bounce off the downtrend line that had previously acted as a strong resistance. This is a positive sign. If the bulls can push the price above $8,452.84, it will signal the possible start of a new uptrend.
BTC USD daily chart. Source: Tradingview
The 20-day EMA is sloping up gradually and the RSI is in the positive zone, which suggests that bulls have the upper hand.
Our bullish view will be invalidated if the bulls fail to scale and sustain the BTC/USD pair above $8,452.84. The pair will turn negative if the price slips below the moving averages and the critical support at $7,000. Therefore, traders can keep a stop loss on the long positions at $6,800. We shall recommend trailing stops higher at the first available opportunity.
ETH/USD
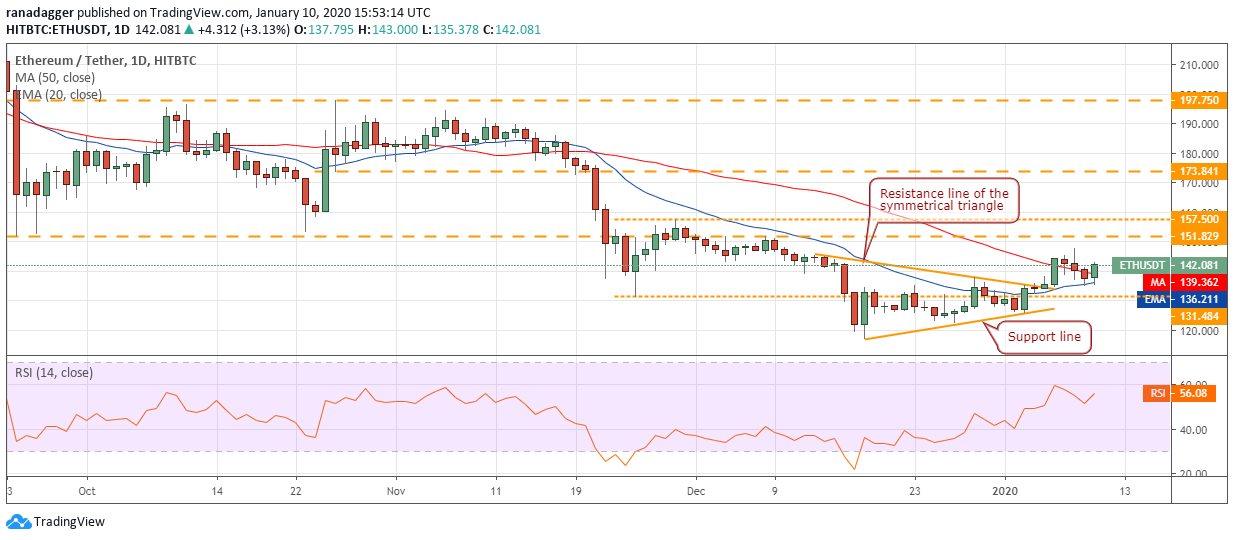
The bulls have defended the 20-day EMA for the past two days, which is a positive sign. They will now try to carry Ether (ETH) to the $151.829 to $157.50 resistance zone. The moving averages are on the verge of a bullish crossover and the RSI is in the positive zone, which suggests that bulls have the upper hand.
ETH USD daily chart. Source: Tradingview
A breakout of the zone can propel the ETH/USD pair to $173.841. Traders can watch the price action closer to the $151.829 to $157.50 resistance zone and book partial profits if the bulls fail to scale it. However, if the momentum carries the price above the resistance, the stops can be trailed higher to protect the paper profits.
Our bullish view will be invalidated if the price turns around and sinks below the moving averages and $131.484. For now, the traders can retain the stop loss on the long positions at $122.
XRP/USD
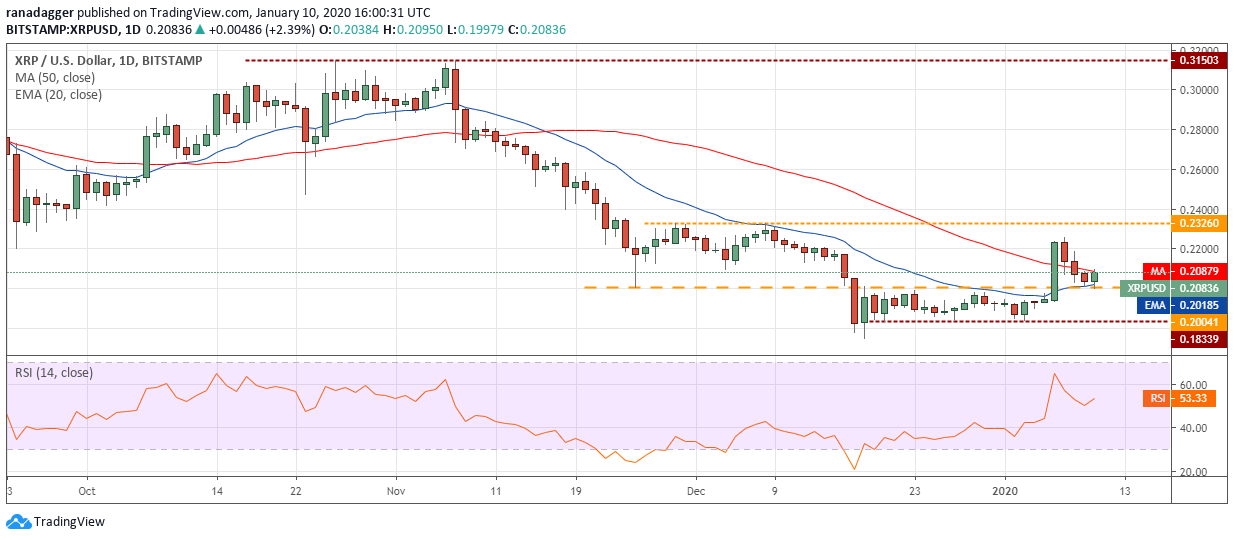
XRP has given up most of the gains seen on Jan. 6. This is a negative sign as it shows a lack of buyers at higher levels. The price is currently attempting a bounce off the strong support at the 20-day EMA. The horizontal support at $0.20041 is also placed at this level, hence, we anticipate the bulls to defend the level aggressively.
XRP USD daily chart. Source: Tradingview
If the XRP/USD pair rises above the 50-day SMA, the bulls will attempt to carry the price to $0.2326. The flattening 20-day EMA and the RSI just above the 50 level suggests a range-bound action for a few days.
The pair will pick up momentum above $0.2326. Above this level, a rally to $0.31503 will be on the cards. On the other hand, if the bears sink the price below $0.20041, the pair can retest the strong support at $0.18339. We do not find a reliable buy setup yet, hence, we are not proposing a trade in it.
BCH/USD
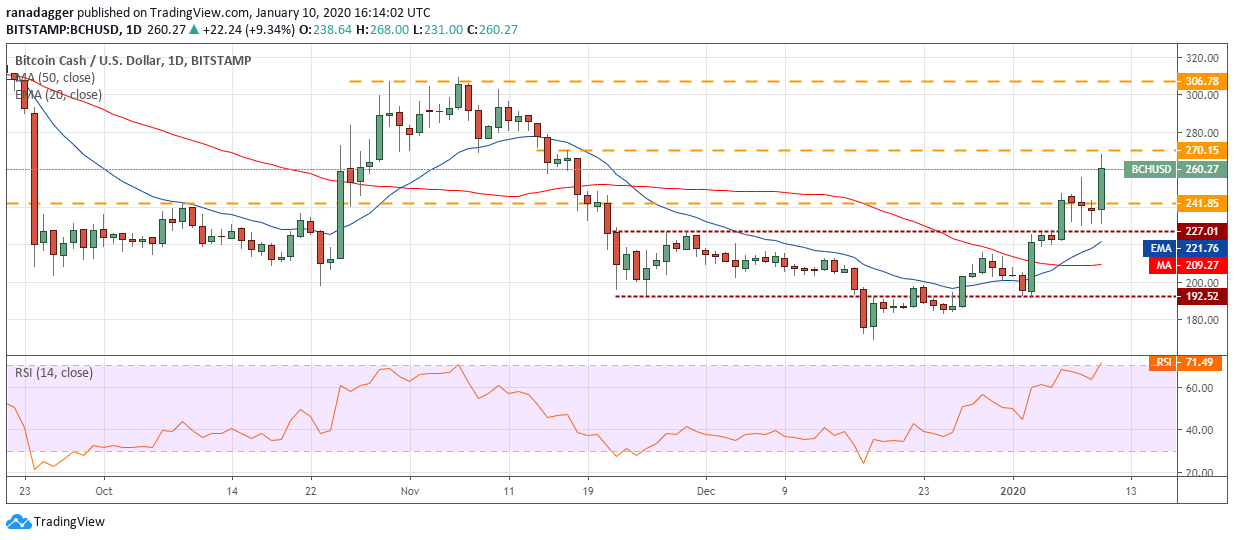
The bulls defended the breakout level of $227.01 for four days, which is a positive sign. This shows buying on dips. Bitcoin Cash (BCH) has resumed its up move towards the target objective of $306.78.
BCH USD daily chart. Source: Tradingview
There is a minor resistance at $270.15, but we expect it to be crossed. The 20-day EMA is sloping up and the RSI is close to the overbought zone, which suggests that bulls are in command. We suggest traders trail the stops on their remaining long positions to $226. The stops can be tightened further after the price scales above $270.15.
Our bullish view will be invalidated if the BCH/USD pair turns down from the current levels and plunges below $227.01.
LTC/USD
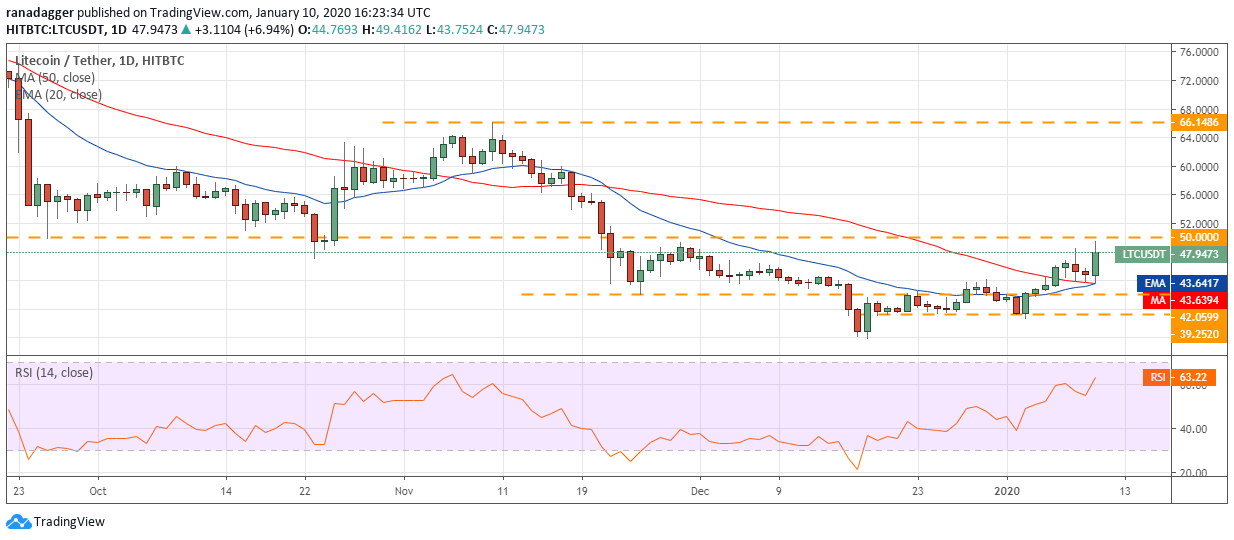
Litecoin (LTC) has bounced off the moving averages, which is a positive sign. The moving averages are on the verge of a bullish crossover and the RSI is in the positive zone, which suggests that the bulls are in command.
LTC USD daily chart. Source: Tradingview
The altcoin has reached close to the overhead resistance at $50. If the bulls can scale the price above $50, a move to $60 and above it to $66 will be on the cards.
However, if the bulls fail to push the price above $50, the LTC/USD pair might remain range-bound for a few days. It will turn negative on a break below $42.0599. The traders can trail the stop loss on the long position to $42.
EOS/USD
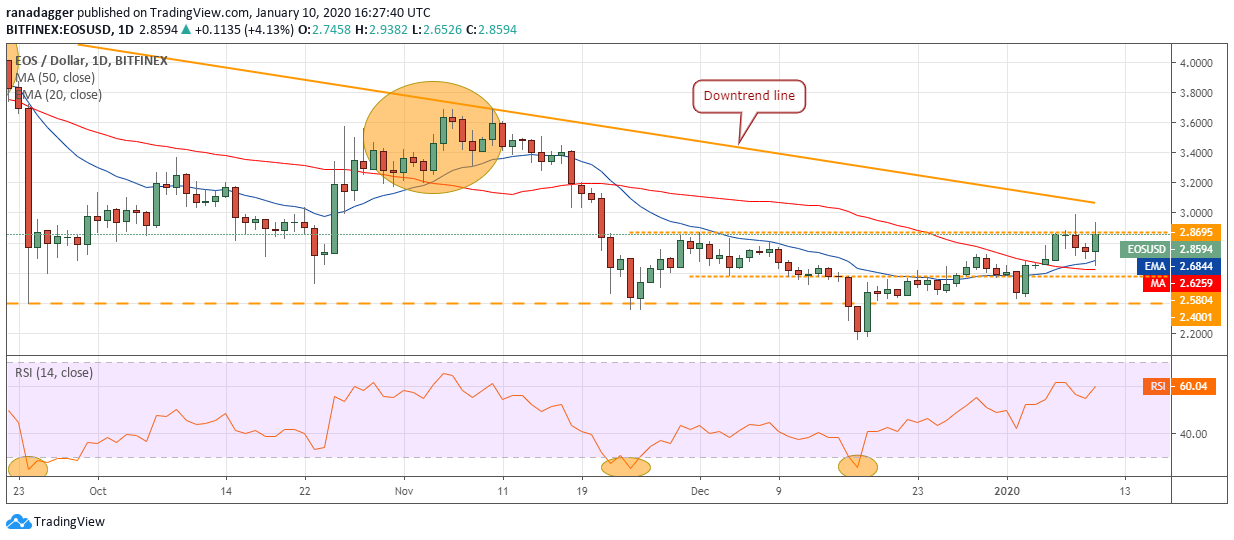
EOS has bounced off the support at the moving averages, which is a positive sign. The bulls are attempting to push the price above the overhead resistance at $2.8695. If successful, a move to the downtrend line is possible.
EOS USD daily chart. Source: Tradingview
The downtrend line remains the critical resistance to watch out for. A breakout of this line will signal a change in trend. Therefore, the traders can keep the stop loss on the remaining long positions at breakeven. Our bullish view will be invalidated if the bears sink the EOS/USD pair below $2.5804.
BNB/USD
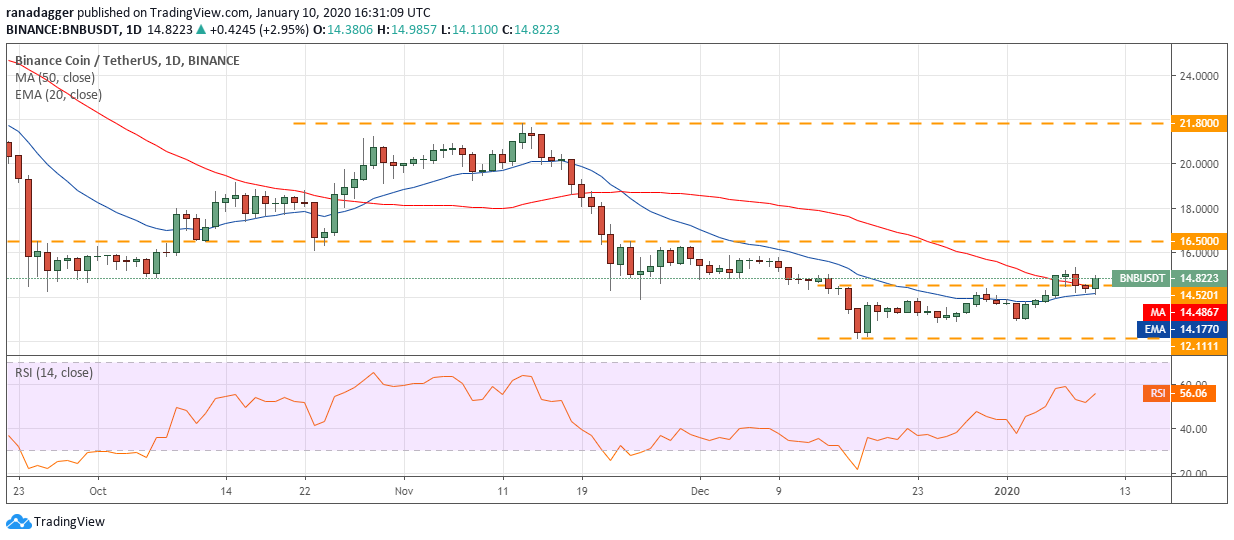
The bulls are attempting to defend the 20-day EMA. If successful, Binance Coin (BNB) might again attempt to move towards $16.50. The flattish 20-day EMA and the RSI just above the midpoint suggests a balance between the bulls and the bears. The advantage will tilt in favor of the bulls above $15.32.
BNB USD daily chart. Source: Tradingview
Conversely, a break below the 20-day EMA will tilt the advantage in favor of the bears and a drop to $12.98 is possible. Below this level, the next support is at $12.1111. The traders can retain the stop loss on the long position at $12.95.
BSV/USD
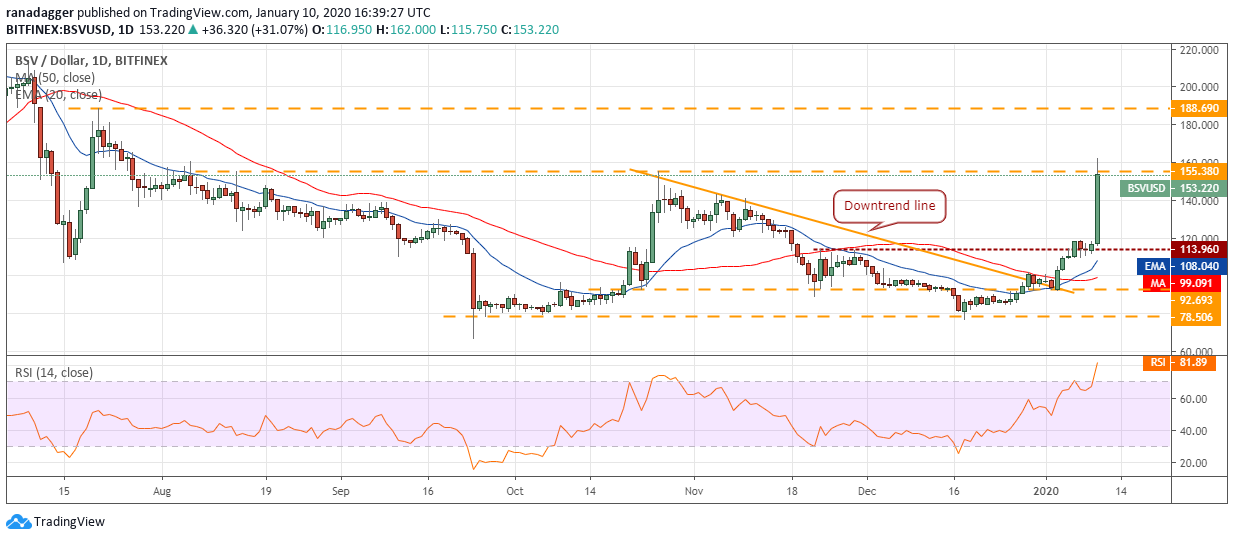
Bitcoin SV (BSV) has resumed its up move and has reached the target objective of $155. This level had previously acted as a stiff resistance, hence, we anticipate the bears to mount a strong defense once again.
BSV USD daily chart. Source: Tradingview
The 20-day EMA is sloping up and the RSI is in the overbought zone, which shows that bulls are in command.
If the price sustains above $155.38, the BSV/USD pair can move up to $188. The traders can watch the price action at the current levels and book partial profits close to it. The stops on the remaining long positions can be trailed higher to protect the paper profits.
XMR/USD
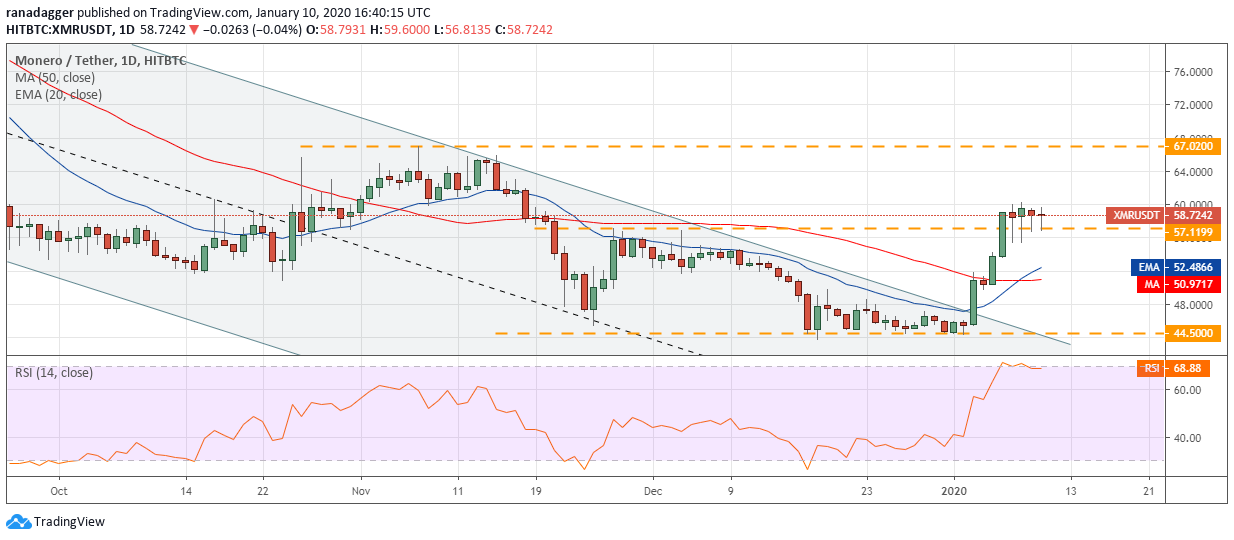
Monero (XMR) has been holding above the immediate support at $57.1199 for the past four days. The dips below this level have been bought aggressively by the bulls, which shows demand at lower levels.
XMR USD daily chart. Source: Tradingview
If the bulls can push the price above $60.2991, a move to $67.02 is likely. The short-term traders can ride this move higher by buying at $60.4 with a stop loss at $55. The upsloping 20-day EMA and the RSI close to the overbought zone suggests that bulls are in command.
Our bullish view will be invalidated if the price turns down from the current level and plummets below $55. Such a move can drag the XMR/USD pair to the next support at the 20-day EMA, which is at $52.50.
TRX/USD
About five cryptocurrencies have similar market capitalizations. Therefore, depending on their performance on any given day, the ranking keeps changing. Today, Tron (TRX) has again risen into the top ten list of cryptocurrencies by market capitalization.
TRX USD daily chart. Source: Tradingview
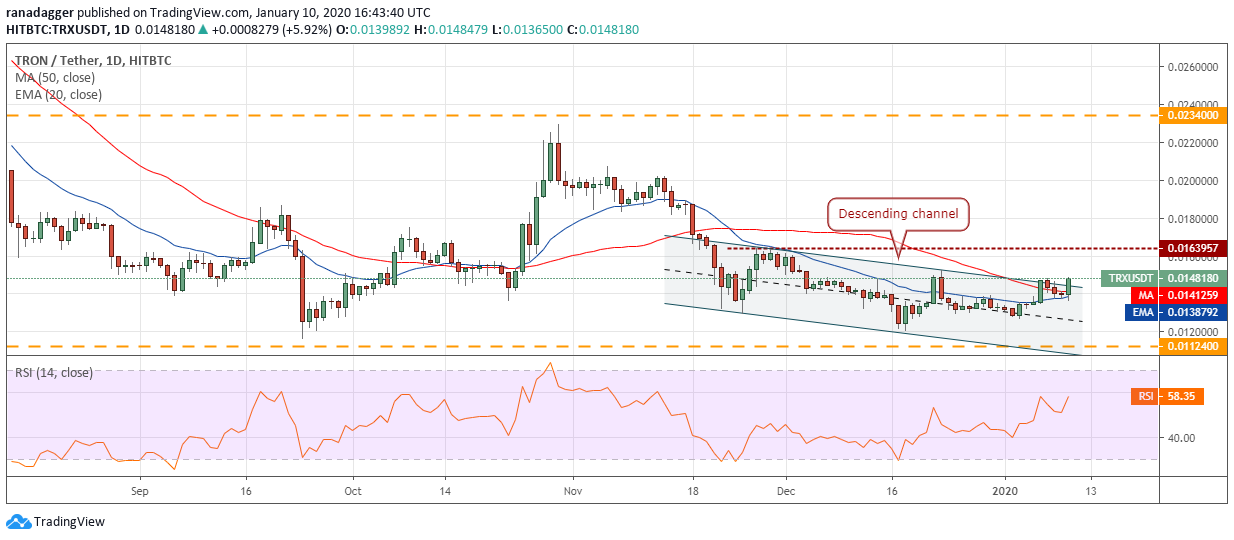
The TRX/USD pair has broken out of the descending channel, which is a positive sign. The moving averages are on the verge of a bullish crossover and the RSI is in the positive territory, which indicates that the bulls are in command.
If the price sustains above $0.015, a move to $0.0163957 will be on the cards. We anticipate this level to act as a stiff resistance. However, if the momentum can push the price above it, a move to $0.020 and above it to $0.0234 is possible. We will wait for the price to sustain above $0.0164 before proposing a trade in it.
The views and opinions expressed here are solely those of the author and do not necessarily reflect the views of Cointelegraph. Every investment and trading move involves risk. You should conduct your own research when making a decision.
Market data is provided by HitBTC exchange.


