View
- Bitcoin has established a higher low near $3,300 in the last two months, signaling bearish exhaustion.
- However, a break above the Christmas Day lower high of $4,236 is needed to confirm a bearish to bullish trend change.
Bitcoin (BTC) needs to climb at least anther $350 to confirm a long-term bullish reversal, technical charts suggest.
The leading cryptocurrency by market value is currently trading at $3,903 – having rallied 24.8 percent from this year’s low of $3,122 seen in December. This positive trend has spurred hopes that the sell-off from the late 2017 record high of $20,000 is over.
Validating that argument are a number of long duration technical indicators flashing early signs of bullish reversal. To name a few, the weekly moving average convergence divergence (MACD) is at its most bullish for over a year. The money flow index, which takes into account both bitcoin’s price and trading volume, is also trending north, validating the bullish divergence created in December.
That said, BTC is yet to invalidate the most basic of all bearish technical indicators – a lower high, lower low.
Weekly chart (2018-2019)
On the weekly chart, BTC has been charting regular bearish lower price highs and lower price lows since January 2018. These were essentially shallow bounces that ended up recharging the engines for a drop to further lows.
The last lower high of $4,236 created on Christmas Day, however, failed to challenge the preceding lower low of $3,122. And since then, BTC has been creating higher lows in the region of $3,300.
While the latter is evidence of seller exhaustion, a bullish reversal would only be confirmed if and when BTC prints a higher high above the Christmas Day lower high. Put simply, a break above that level is needed to mark a successful transition from bearish to bullish trend change.
So, with bitcoin’s price currently trading at $3,890, that target is still $350 away.
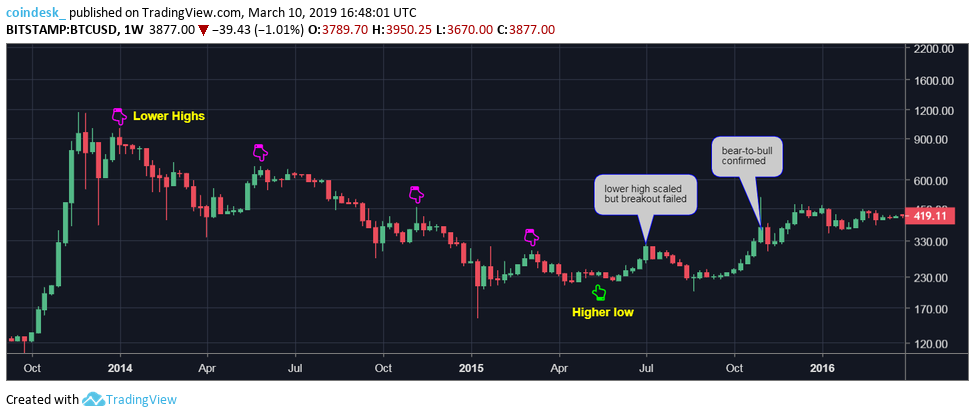
Weekly Chart (2014-2015)
As seen above, the previous bear market ended with bitcoin charting a higher low near $230 in April 2015. The bullish reversal was confirmed in November 2015 when BTC convincingly breached the bearish lower high of $297 carved in March 2015.
It’s worth noting the failed breakout above $297, witnessed in July, which was followed by a drop all the way back to $200.
Disclosure: The author holds no cryptocurrency assets at the time of writing.
Bitcoin image via Shutterstock; charts by Trading View


