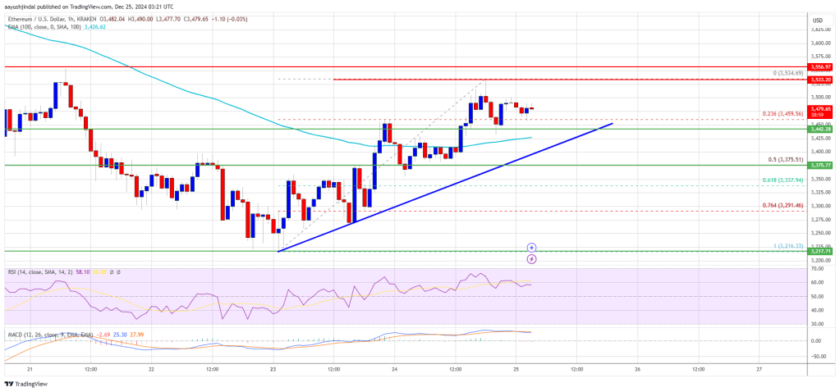
Ethereum is up around 5% and trading above key hurdles near $140 versus the US Dollar. Bitcoin and ripple surged 5% and 12% respectively, opening the doors for another increase in ETH.
- Ether price is now trading above the key $140 and $142 resistance levels against the US Dollar.
- BTC rallied recently and tested the $8,000 resistance area.
- There is a major bullish trend line forming with support near $138 on the hourly chart of ETH/USD (data feed via Kraken).
- ETH seems to be eyeing more upsides above the $145 resistance area.
Ethereum Price Could Test $150
This week, there were strong gains in Ethereum above the $135 resistance against the US Dollar. Moreover, both bitcoin and ripple started a strong surge in the past few sessions and rallied above $7,800 and $0.2150 respectively.
ETH remained in a positive territory and gained pace above the $138 resistance area. Recently, there was a successful break above the $140 resistance, plus a close above the 100 hourly simple moving average.
A new 2020 high is formed near the $145 level and the price is currently consolidating gains. An initial support is near the $143 level, and the 23.6% Fib retracement level of the recent wave from the $139 swing low to $145 high.
On the upside, Ethereum seems to be preparing for an upside break above the $145 resistance. If the bulls gain momentum above the $145 resistance, they could easily push the price towards the $150 resistance.
The next key resistance above $150 is near the $158 level (Nov 2019 resistance zone). A clear break above the $158 hurdle might set the tone for a push towards $167.
Buy Dips In ETH?
In the short term, there could be a downside correction in ETH below $143. However, the $142 level might provide support. The main support area is near the $140 level.
Besides, there is a major bullish trend line forming with support near $138 on the hourly chart of ETH/USD. If there is a dip towards the trend line or $140, the bulls are likely to protect any further losses.
Looking at the chart, Ethereum price is rising steadily and the recent upward move could gain pace above the $145 resistance levels. The next bullish targets may be $150 and $157. Conversely, a close below the $138 level might start a substantial correction.
Technical Indicators
Hourly MACD – The MACD for ETH/USD is currently moving in the bullish zone.
Hourly RSI – The RSI for ETH/USD is now well above the 60 level.
Major Support Level – $140
Major Resistance Level – $145


