Bitcoin is back on the headlines after the outrageous price action it has experienced before and after the halving took place. The flagship cryptocurrency rose to a high of $10,100 on May 7 to then take a 22% nosedive over the weekend. Now, BTC is back up, recovering most of the losses recently incurred.
Regardless of the high levels of volatility, one of the most prominent analysts in the cryptocurrency industry estimates that Bitcoin is poised for a steep correction before continuing its historic bull run.
Bitcoin Faces Strong Resistance Ahead
The trading aficionado, who is well-known for his bold price predictions, maintains that there are many reasons to believe that the bellwether cryptocurrency is reaching overbought territory. The moving average convergence divergence (MACD), for instance, turned bearish within BTC’s daily chart.
The chartist suggested that as the 12-day exponential moving average moved below the 26-day exponential moving average, the odds for a retracement from the current price levels increased substantially.
MACD Turns Bearish On BTC’s 1-day chart. (Source: Twitter)
Additionally, there is a significant resistance barrier ahead of the pioneer cryptocurrency that could prevent it from advancing further up. This supply wall is currently represented by a descending trendline that dates back to December 2017.
Since then, this resistance level has been able to reject the June 2019 upswing towards $14,000, the mid-July 2019 push to $13,200, the early August 2019 upward movement to $12,300, and the mid-February 2020 impulse to $10,500.
While it is reasonable to believe that resistance weakens over time, the more it is tested, this multi-year trendline still has a lot of significance to Bitcoin’s trend. If it continues to hold, the flagship cryptocurrency may be bound for another retracement towards $6,300, according to the analyst.
A bearish impulse to this support level could help wipe out some of the so-called “weak hands” while allowing sidelined investors to get back into the market.
Bitcoin Faces Strong Overhead Resistance. (Source: Twitter)
A new inflow of fresh capital into the industry could eventually take Bitcoin to finally break above the overhead resistance and enter the full-blown bull market that most investors and crypto enthusiasts alike have been expecting.
Whales Are Filling Their Bags
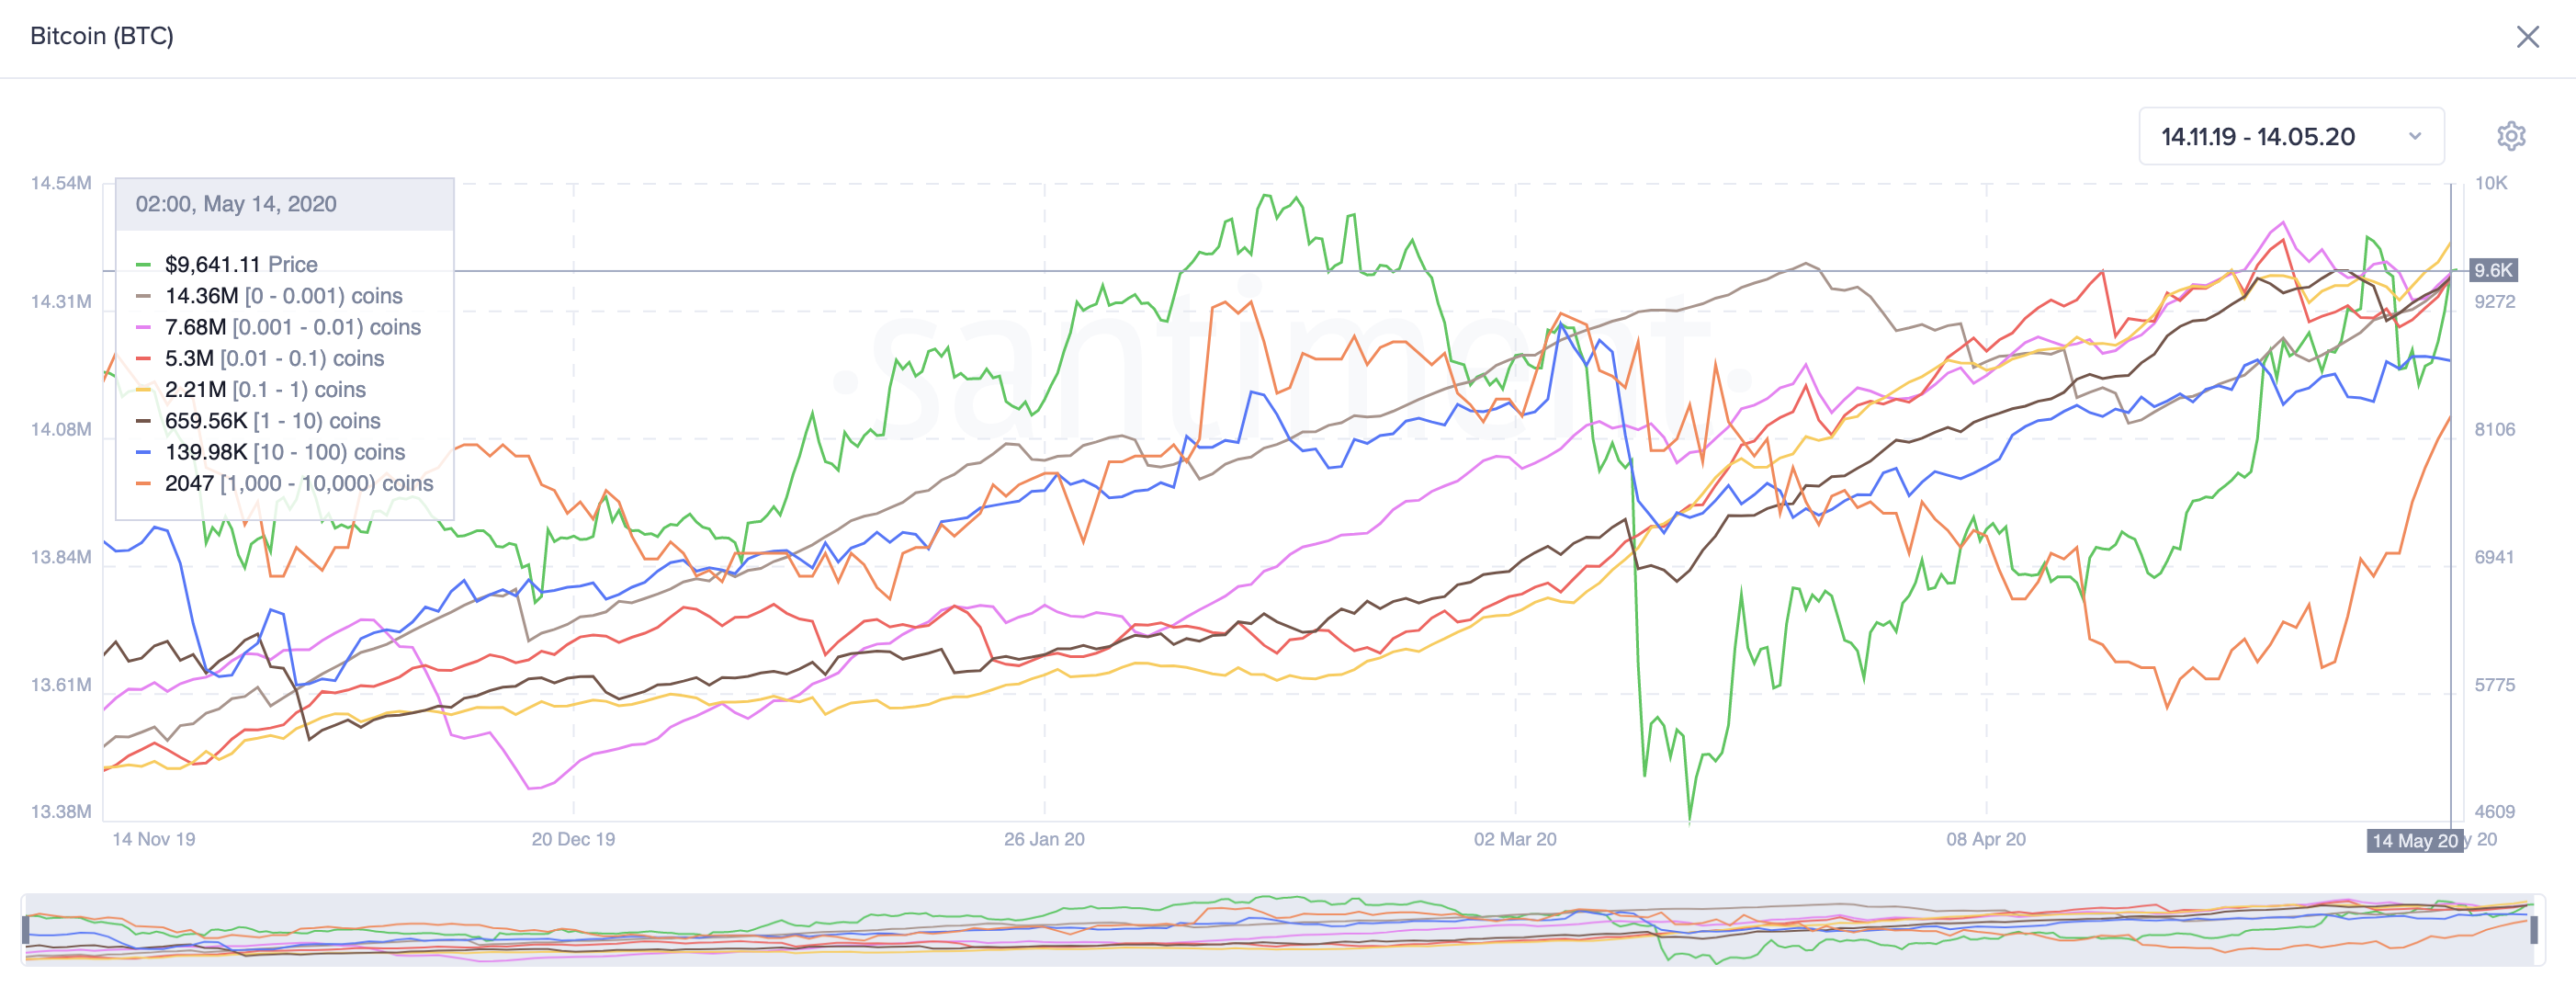
Even though everything seems to point out that a correction is underway, Data from Santiment reveals that the number of BTC “hodlers” in the network is rising at an astronomical pace.
The firm’s “holders distribution” chart shows that the number addresses with 0.001 to 100 BTC, which can be considered retail investors, have has been steadily growing over the past six months, reaching higher highs.
Meanwhile, the number of larger whales with 1,000 to 10,000 BTC started increasing in late April, which coincides with billionaire Paul Tudor Jones’s entry into the market.

Bitcoin Holders Distribution. (Source: Santiment)
Due to the state of commotion around the global economies, it is vital to pay close attention to Bitcoin’s price action over the next few days.
Breaking above the aforementioned descending trendline would be seen by many as the beginning of a new bull cycle. Conversely, a rejection from this resistance level will open the gates for those who missed the boat to place their bullish bets.
Featured Image from Unsplash


