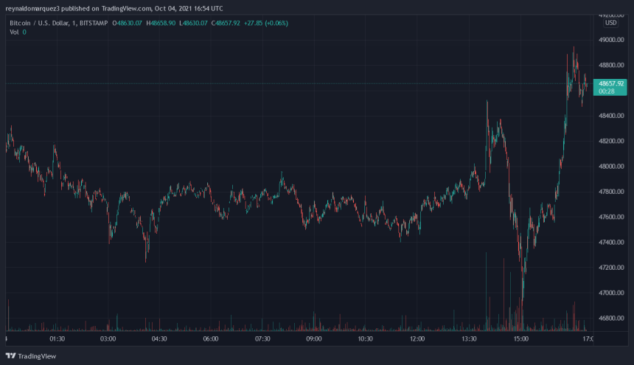
Bitcoin has been moving on a sideways trajectory after a decline from the $49,000 area. The first cryptocurrency by market seems to be displaying conviction, as the bears are unable to retake control of the current price action.
Related Reading | Bitcoin Price Blasts Off With 10% Move, But Is This The Start Of More?
At the time of writing, BTC trades north of $48,000, a critical support zone that could support a fresh jump into previous highs. Although in lower timeframes there has been some “crab like” action, higher timeframes still record important gains.
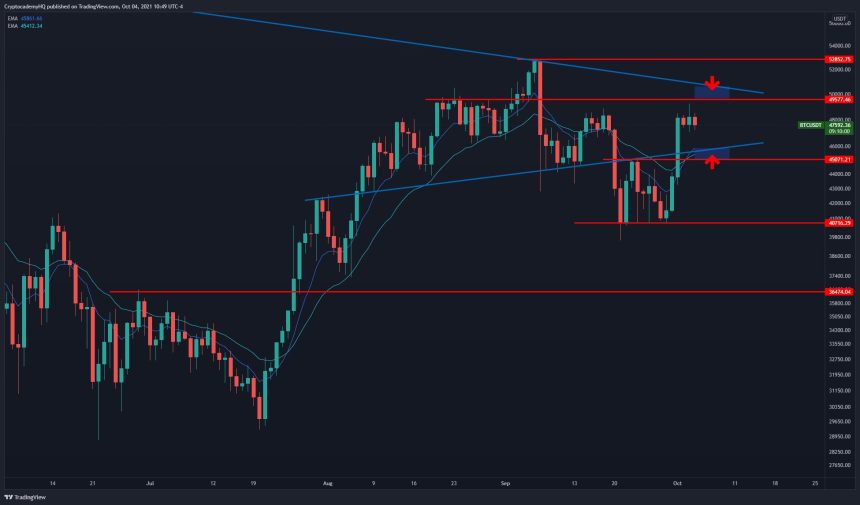
Trader Justin Bennet believes the key of the next leg up will be unlock as Bitcoin moves back into the $50,000 to $53,000 area. If the bulls can break above those levels, BTC’s price should re-entered the $60,000 zone for the first time since May 2021.
Otherwise, Bitcoin could still see some downside risk towards the middle area of its current levels at $45,000. Failure to sustain that support could see BTC return to the $40,700 area with danger of slipping further into the $36,500, as seen below.

Unlike September, October has been historically a green month for BTC. Many traders are betting on this possibility.
Therefore, the quick turn in the market sentiment to bullish as BTC climbed its way up from the low $40,000 to its current levels. In addition, trader John Wick believes there are the right ingredients and environment to support a new all-time high, as seen below.

Bitcoin At A Crossroads, Why More Gains Could Result In A Fresh ATH?
In a separate report by Glassnode Insights, analyst Checkmate recorded that 10.3% of Bitcoin supply returned to an unrealized profit state. This suggest a lot of buyers entered positions as BTC was moving in the $40,000 to $41,000.
Related Reading | TA: Bitcoin Turns Green, Why BTC Could Soon Breach $50K
Thus, why BTC’s price could have found a “price floor” around those levels. As of now, about 86.6% of BTC’s total supply stands at unrealized profit, as seen in the chart below.

This increases the incentives for investors to take either of the two routes depending on Bitcoin price action. More investors could hold on to their profits, if the price continues to rally, or they could realize some of their gains if the price goes the other way. The analyst said:
If the market were to continue to trend higher and into a bullish continuation, this fractal would be similar to both the 2013 and 2017 market. In both prior cycles, a NUPL value of 0.5 acted as a ‘support’ level during major corrections as the market’s profitability and conviction to hold was tested, bounced and subsequently rallied higher.
In support of the bullish thesis, Glassnode records a $1.75 billion capital inflow per day into the market as buy demand.
Related Reading | Why The Bitcoin At $100K Discourse Remains Strong Despite Market Crashes
In addition, the Spent Volume Age Bands, a metric used to measure the total percentage of BTC’s supply exchanging hands, suggest “old hand have strong conviction and are not spending at current prices”.


