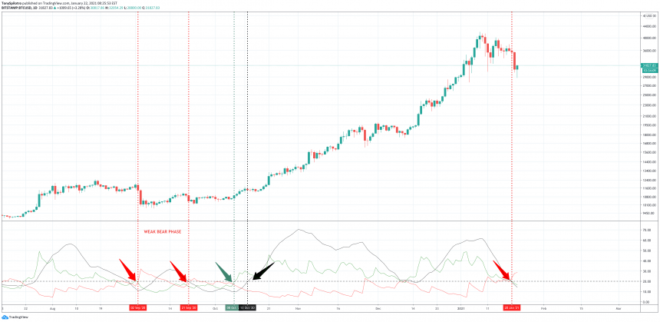
Bitcoin price has now pulled back a full $13,000 from 2021 high to low. Yesterday’s massive bearish, red candle is one obvious sign that the trend is turning. However, a technical analysis tool used to gauge the strength of trends also confirms that bears have taken over the reigns from bulls and it could lead to a short-term downtrend.
Bitcoin Bears Regain The Upper Hand, Reclaim Crypto For First Time Since October
Bitcoin is undeniably in an uptrend, and according to comparisons with past market cycles, things are only just getting warmed up.
But that doesn’t mean that the higher timeframe trend can’t be up, while the shorter-timeframe intraday trends heads down – or that price action across days and weeks can’t temporarily turn bearish.
Related Reading | Career Trader Subtly Hints Of Bitcoin Parabola Breakdown With Fractal Diagram
That’s exactly what has happened recently, with the top cryptocurrency shaving as much as $13,000 off its price from high to low. Yesterday’s daily close left behind an extremely bearish candle and reminder that asset prices don’t only move up in a straight line.
The recent parabola might have been broken, which could suggest a sharper correction is coming. Some of the best traders and analysts are expecting more downside before things turn back up.
The Average Directional Index and DMI show bears have taken over daily timeframes | Source: BTCUSD on TradingView.com
The Average Directional Index confirms the bearish price action. The red DMI moving so sharply above the green is a clear sign that bears are now in control of the cryptocurrency’s daily trend once again.
The ADX itself is still well below 20, so the trend hasn’t yet fully taken hold. What’s notable is that this is the first time bears have reclaimed Bitcoin since October when FOMO spun out of control.
Trend Strength Measuring Tool Shows Bulls Aren’t Down For The Count Just Yet
The ADX is used to gauge the strength of the underlying trend, and like most tools, higher timeframes provide the most dominant signals.
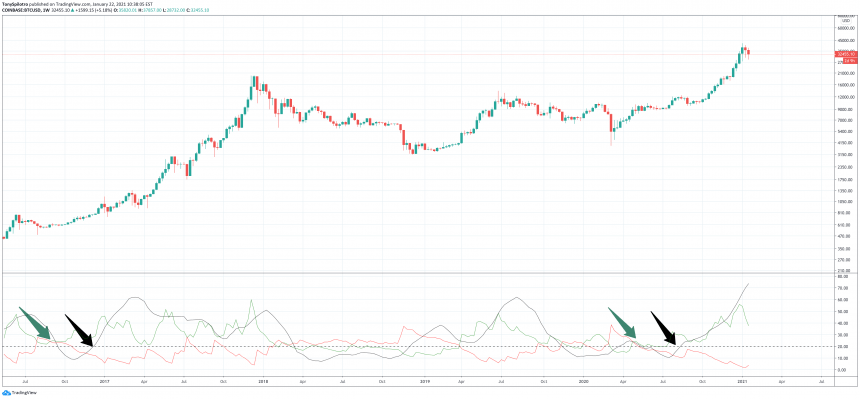
Bears have won on the daily, but on weekly timeframes, however, the same tool shows that bears don’t really have a chance, and any downward momentum will be short-lived before bulls regain control.
The Average Directional Index and DMI show bears have taken over daily timeframes | Source: BTCUSD on TradingView.comOftentimes, corrections in assets are healthy, confirm resistance as support, and reignite buying interest by reaching more attractive price levels.
Related Reading | The Striking Similarities Between The 2017 Bitcoin Peak And Now
Could the pullback be exactly what Bitcoin needs to refuel and rocket higher? Or are there simply too many similarities shared with the 2017 peak to ignore the potential of a longer downtrend in the weeks ahead?
Featured image from Deposit Photos, Charts from TradingView.com


