After 11 months of relentless bears, statistics from Susquehanna, a US based trading and technology firm has confirmed that mining Ether is no longer profitable. This is mostly due to a relentless bears that have since drove prices from $1400 to $200. Because of this, monthly mining profitability is now zero, down from $150 registered mid last year.
The Drop in ETH Mining is Because of Serenity
Unlike Bitcoin, Ethereum mining utilizes GPU chip sets. Though they guarantee complete decentralization, Ethereum does not have a predetermined issuance model. Then again at the moment there is no cap on the total amount of ETH that will ever circulate.
You May Like: Have All ICOs Sold Out? A Look at the Altcoin Survivors
Ethereum rewards consist of block rewards issued per the platform’s development roadmap. Eventually, it shall move to a proof-of-stake model and the inflation rate will depend on ETH stake. So at the moment, in order to smoothly transition from proof-of-work to proof-of-stake, a difficulty adjustment scheme is in place to exponentially increase the difficulty of mining ETH.
Interesting Read: ConsenSys and Amazon to Launch Ethereum Marketplace for Enterprise Blockchain
This would eventually force mining to become unprofitable and force a hard fork to use the proof-of-stake protocol. In order to address the impending mining difficulty, adjustment of the issuance model was necessary. As a result, during the Byzantine hard fork of 2017, block rewards were shaved from 5 to 3.
17/ Since the difficulty bomb is only going to be delayed for one year, another hard fork will be necessary on or around January 2020. #Ethereum will be experiencing a significant decline in its inflation rate as the roadmap advances.
— The Element Group (@TheElementGrp) November 13, 2018
In the upcoming Constantinople hard fork, core developers plan to reduce block reward issuance from 3 to 2 by mid January 2019 while pushing difficulty bomb implementation to 2020. Next year’s 33 percent reduction in the block reward will reduce inflation from its current level of 7.5 percent to 5 percent.
ETH/USD Price Analysis
Weekly Chart
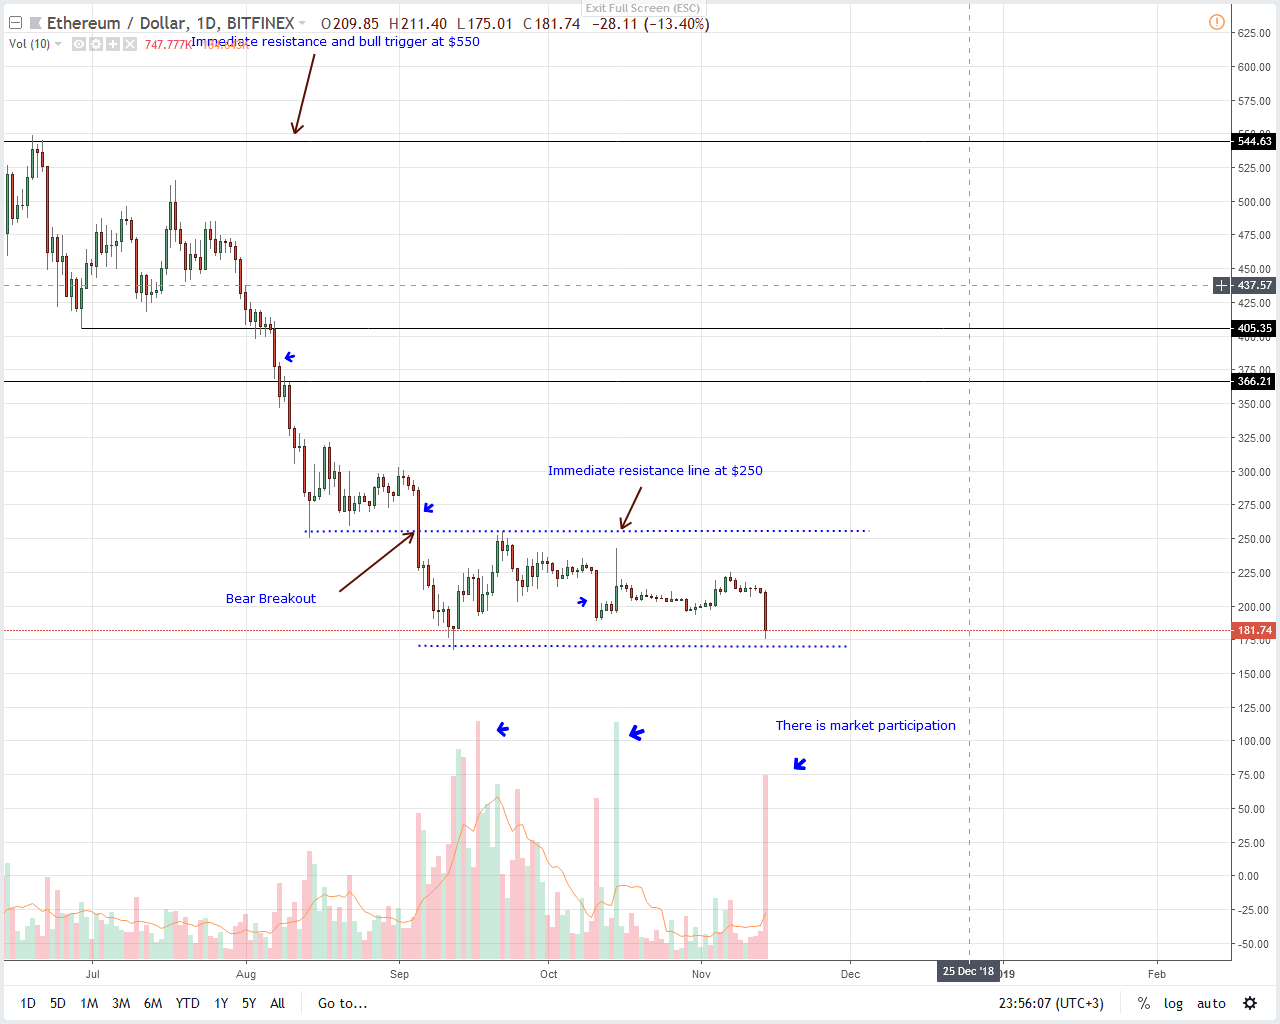
From a top down approach, it is clear that ETH/USD is struggling against sellers. Not only is it trading within a bear breakout pattern with clear point of interest at $250–$300 as resistance and $160 as support, but the fundamental factors are supportive of price.
Therefore in line with our previous ETH/USD price analysis, we recommend patience for risk-on traders until after there are strong, high volume losses below $160—Sep 2018 lows. Such breaks will confirm the bear breakout pattern of early August and usher the next wave of sellers aiming at $130 and later $50.
Daily Chart
The bear break out pattern of early Aug and Sep is clear in this time frame. Now that prices are in a clear bear trend confirming Oct 11 and Sep 5 losses as sellers step up, aggressive traders can begin unloading at spot with stops at $210 and first targets at $130 more so if there are solid losses below $160—Sep lows.
As aforementioned such losses shall trigger conservative sellers aiming at $130 and later $50.
All Charts Courtesy of Trading View
Disclaimer: Views and opinions expressed are those of the author and aren’t investment advice. Trading of any form involves risk and so do your due diligence before making a trading decision.


