While Bitcoin (BTC) has seen a parabolic rally since September, the momentum has stagnated as with BTC/USD unable to break through the all-time high region.
This BTC price level below $20,000 has been accompanied by diminishing volatility and volume, making it increasingly difficult to predict the direction of the next move. Let’s take a look at the crucial levels where volatility could be expected on the lower timeframes.
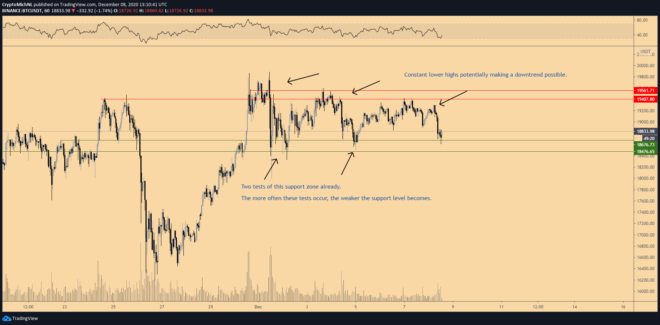
The lower timeframe charts show an apparent range-bound construction that has led the volume and volatility to subside.
The establishes ranges are now $19,400-19,600 and $18,400-18,600. The $19,400-19,600 is the resistance zone, as the price is having a difficult time clearing this hurdle. On the other hand, buyers are stepping in at the $18,400-18,600 area, which is serving as the lower bound of the current range.
Bulls can argue that there’s a stable structure of higher in progress. At the same time, bears can argue that there are constant lower highs being established on the lower timeframes.
Such arguments are the reason why traders are ambivalent about where the price is going in the short term. But what can be expected is heavy volatility once either of these levels is broken.
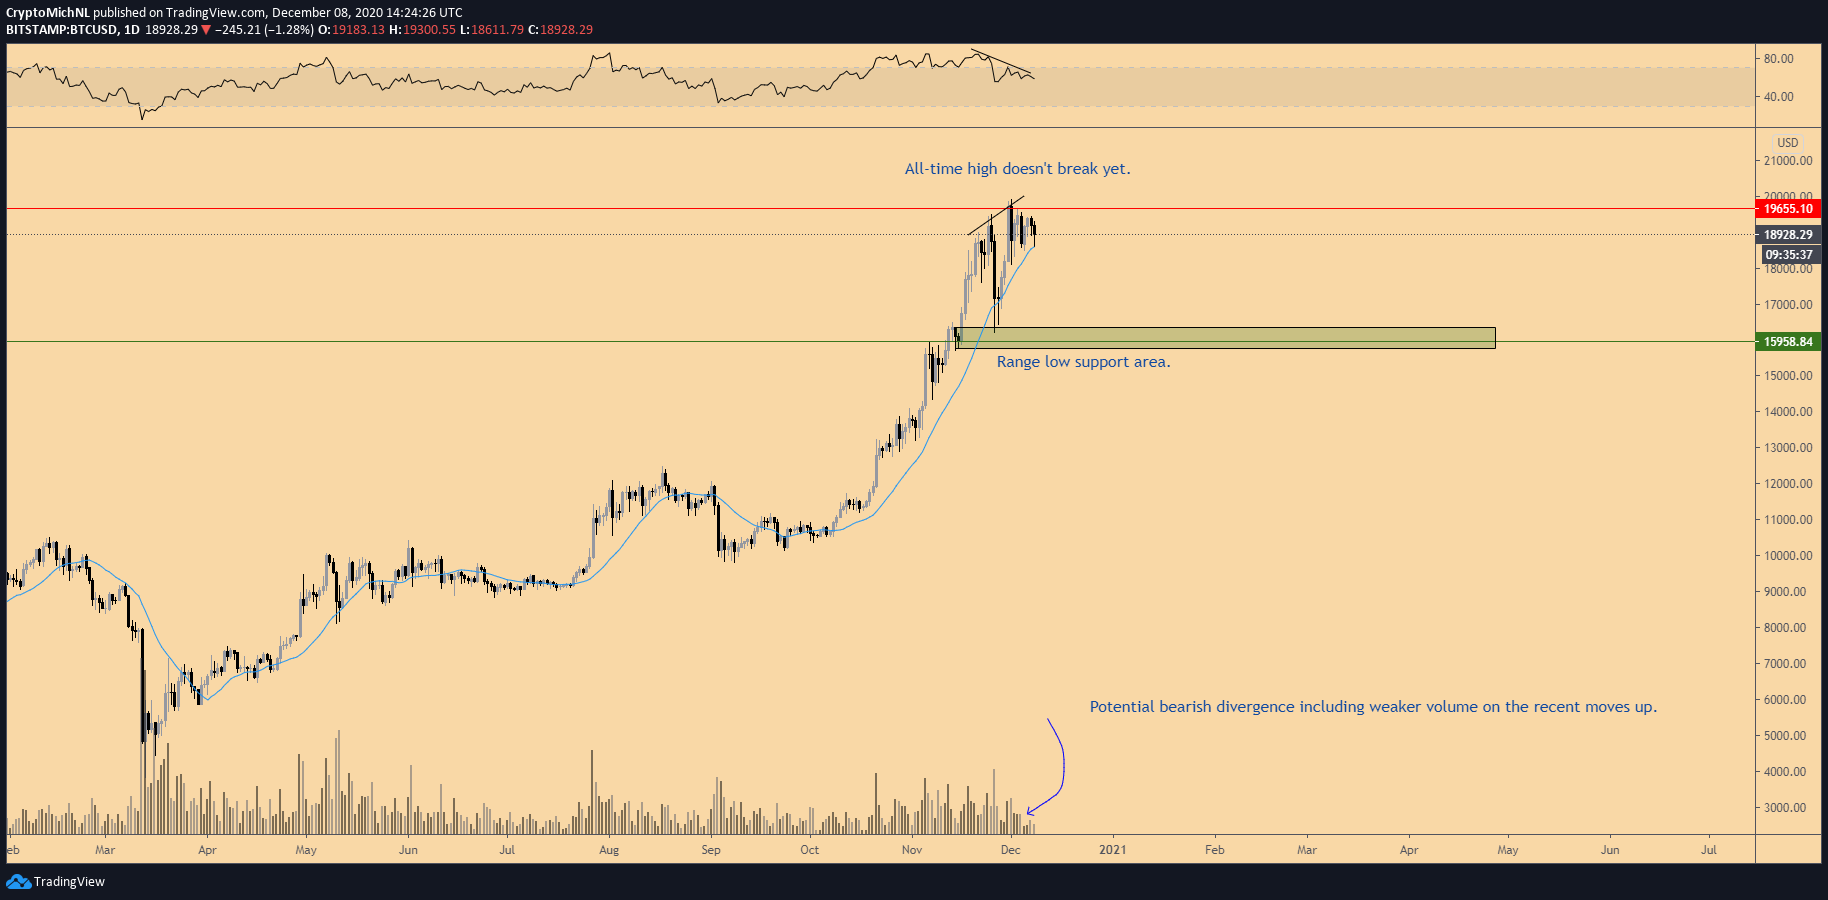
Potential bearish divergence on the daily timeframe
The daily timeframe shows a possible bearish divergence, which would be confirmed once Bitcoin’s price drops below $18,500.
Moreover, if such a drop occurs, the 21-Day MA (Moving Average) will be lost as crucial support that has been intact throughout the current uptrend, as the chart shows.
More downside is likely if Bitcoin’s price drops below the 21-Day MA with the $16,000 as the next logical support zone. This is a significant daily area, which has already been tested once as support.
In fact, this area can become very significant in the coming months as BTC grinds its way up to the all-time high. This is because such a move would be very similar to the bull market cycle in 2016.
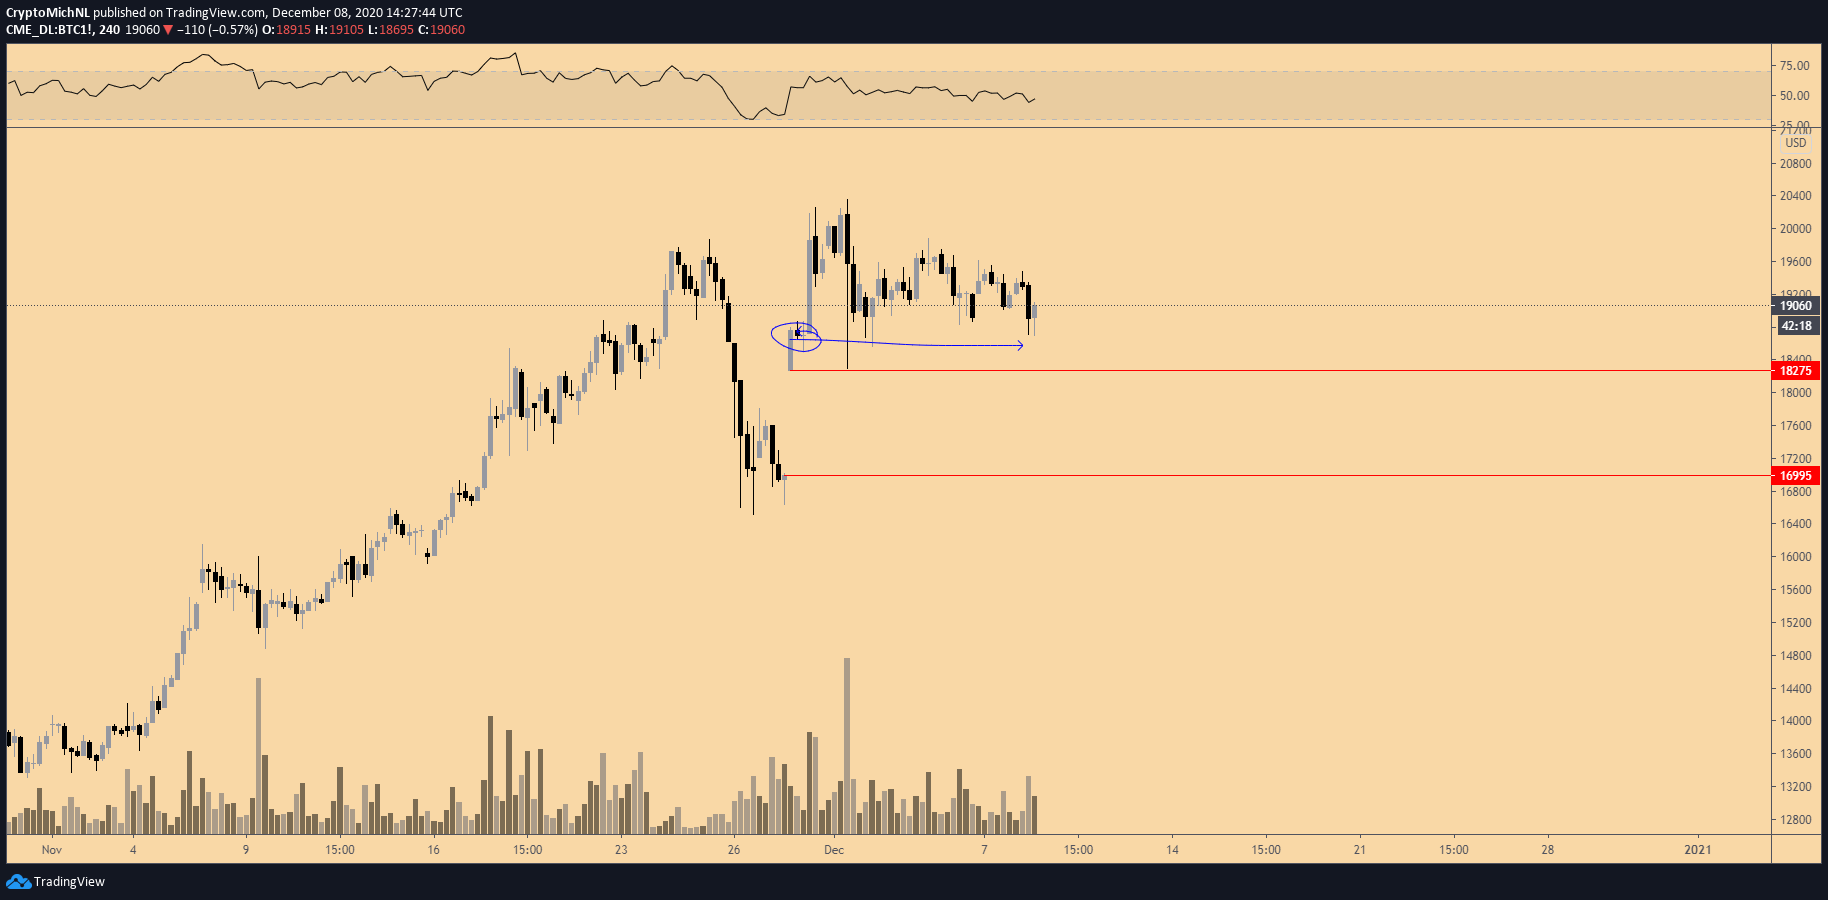
The CME chart shows a large futures gap, which is still ready to be filled. Generally, 95% of the CME gaps get filled, which raises the probability of price dropping back to these levels in the short term.
Traders and investors should be aware that such a correction might be correlated with a bounce in the Dollar Currency Index (DXY). If this occurs, altcoins will likely show even more weakness if the price of BTC corrects further.
The views and opinions expressed here are solely those of the author and do not necessarily reflect the views of Cointelegraph. Every investment and trading move involves risk. You should conduct your own research when making a decision.