
Total crypto market cap added $14.5 billion to its value since Monday morning and now stands at $208.8 billion. Top ten coins are mostly flat for the last 24 hours. Bitcoin SV (BSV) and Tezos (XTZ) registered 1.6 and 3.6 percent of increase respectively. At the time of writing Bitcoin (BTC) is trading at $7,312 on the Bitstamp daily chart, while Ether (ETH) moved up to $170 and Ripple’s XRP is hovering around $0.199.
BTC/USD
Bitcoin suffered another rejection at $6,900 on Sunday, April 5 and fell down to $6,770, still closing the week 15.5 percent up.
The BTC/USD pair opened the new trading period on Monday by drawing a huge green candle to $7,353. The successful break of the ascending triangle that was formed near $6,900 – $7,000 on the daily timeframe resulted in an 8 percent price increase.
On Tuesday, April 7 the coin was again quite volatile, moving in the $7,486-$7,062 zone before closing with a small loss to $7,203. It was stopped near the 50-day EMA, so bulls could not reach the next obvious target – $7,700.
The mid-week session on Wednesday was seen as a continuation of the bull trend after the profit-taking activities that caused the drop in the previous session.
Bitcoin moved up to $7,372 but struggled to surpass the 50-day EMA due to the slightly decreasing volumes that did not support the upward movement.
The 24-hour volumes climbed up from $32 billion on Monday morning to $50 billion in the early hours of trading on Tuesday then started to lose momentum and stepped down to $42 billion on Wednesday.
ETH/USD
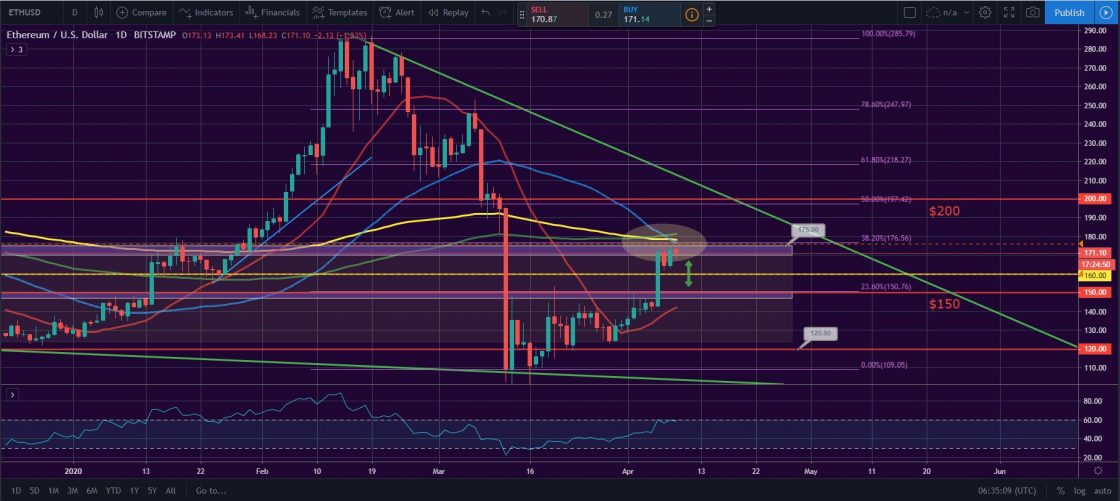
After a successful week, the Ethereum Project token ETH made a slight correction on Sunday, April 5 and closed the week at $142, with a 13.7 percent increase.
The new seven-day period started with a bang as the leading altcoin skyrocketed all the way up to $171. The move resulted in a 20 percent increase for the day and the ETH/USD pair was now inches away from the next S/R line situated at $175.
On Tuesday, April 7, the coin fell to $164, but still it remained in the zone above the $160 support line. Bulls were rejected at $175-$176 and as you can see on the provided chart, there is a strong accumulation of EMAs near this horizontal line – the two major long-term moving averages (100 and 200-day) + the 50-day EMA are meeting there. Surprisingly or not, the Fibonacci retracement level 38.20 is also placed at $176 making the area extremely saturated indicator-wise.
The third session of the week saw the “ether” regaining its positions around $174 and completely erased all losses from the previous day.
In terms of trading volumes, they made an increase from $6.8 billion on Monday to $19.8 on Tuesday and back down to $11 on Thursday morning.
Like BTCMANAGER? Send us a tip!
Our Bitcoin Address: 3AbQrAyRsdM5NX5BQh8qWYePEpGjCYLCy4