
Total crypto market cap lost $8.1 billion of its value since Monday morning and now stands at $356.4 billion. Top ten coins were mostly in green for the last 24 hours with Polkadot (DOT) being the best performer for the period adding 18.2 percent to its value. At the time of writing bitcoin (BTC) is trading at $11,386 on the Bitstamp daily chart, while the ether (ETH) continued to slide and reached $383. Ripple’s XRP moved down to $0.274.
BTC/USD
Bitcoin once again re-tested down the weekly support at $11,500 on Sunday, August 23, but suffered yet another (third consecutive) rejection there. The leading cryptocurrency closed the week at $11,631, with a 5.3 percent loss for the period.
According to the BTC/USD chart, the pair opened trading on Monday by moving up to $11,758. The coin, however, faced its first trouble area near the previously stable mid-term uptrend support line, now turned resistance (in white on our chart and better seen on the 4-hour graph). Additionally, the next horizontal resistance on the daily chart was situated just a step away – at $11,800.
On Tuesday, August 25, BTC made a sharp drop to $11,328 and erased another 3.6 percent of its value. Bears were even able to push the price as low as $11,100 during intraday – the zone we consider critical in terms of keeping the uptrend intact.
The mid-week session on Wednesday was a positive one for buyers and bitcoin formed a short green candle to $11,468. On the negative side of things, the price was rejected on its way to break above the $11,500 horizontal level, which confirmed its importance in the current setup.
Next for bulls is to regain the above-mentioned level and move towards $11,800. Down, we see $11,100 as the next major support followed by the monthly support at $10,700.
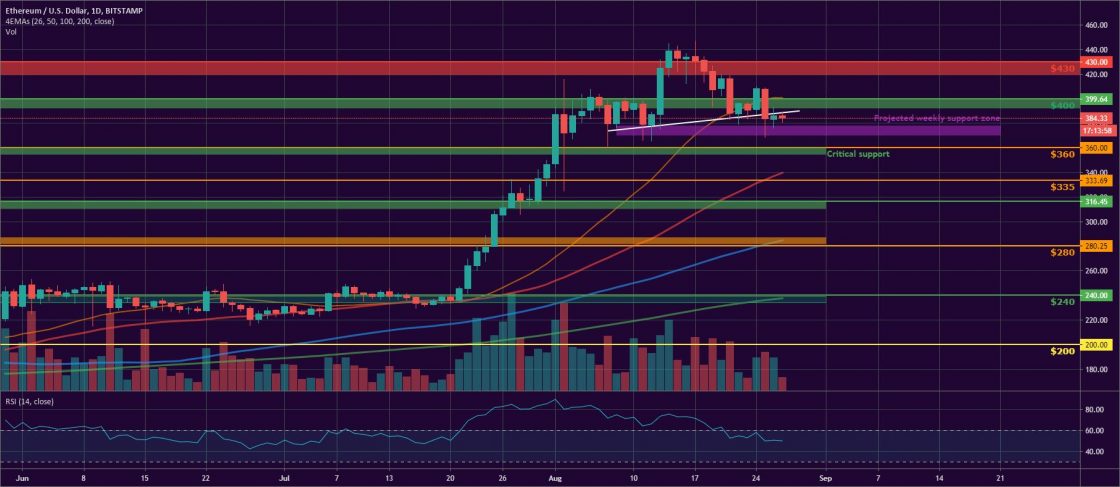
ETH/USD
The Ethereum Project token ETH made another step down to $390 on Sunday, August 23, but still continued to gravitate around the horizontal support zone ($400-$390).
The coin was 10 percent down on a weekly basis.
The ether opened the new trading period on Monday by moving up to $409 in its biggest one-day increase since August 13. This resulted in a 4.6 percent increase as the mentioned horizontal line was successfully surpassed.
On Tuesday, August 25 the ETH dropped down to $383, erased 6.3 percent of its value and even touched the lower end of the support zone on the weekly chart at $370 during intraday.
The Wednesday session found the coin moving in the $393-$376 range just to end up forming a short green candle to $386.
Next for bulls is to re-take the $400 level as important psychological support and consolidate properly before continuing their way up. Down, we see $370 as the next critical support, followed by $360 and $335.
Like BTCMANAGER? Send us a tip!
Our Bitcoin Address: 3AbQrAyRsdM5NX5BQh8qWYePEpGjCYLCy4