Total crypto market cap erased $52 billion from its value for the period since Monday morning and now stands at $937 billion. The top ten coins are all in green for the last 24 hours with Chainlink (LINK) and Polkadot (DOT) registering 9.4 and 6 percent of increase respectively. At the time of writing bitcoin (BTC) is trading at $31,480 on the Bitstamp daily chart, ether (ETH) dropped to $1,297.
BTC/USD
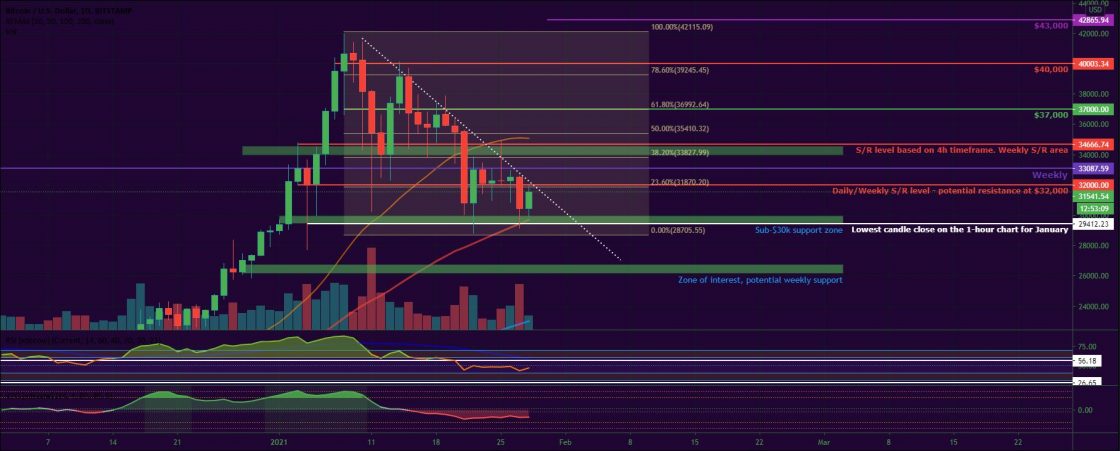
Bitcoin was trading in the wide range between the weekly resistance at $33,000 and the lowest candle close on the 4-h chart at $31,000 on Sunday, January 24. It formed a short green candle to $32,270 at the end of the session and closed the seven-day period with a 10 percent loss.
What’s more important is that the BTC/USD pair continued to be caught in a solid downtrend channel movement and lacked the needed bullish momentum after touching $40,000 on January 14.
On Monday, bulls pushed the price all the way up to $34,900, surpassing both the horizontal resistance zone and the upper boundary of the mentioned channel. Still, it immediately pulled back to $32,270 after touching the short 26-day EMA. The move once again proved how unsustainable a potential reversal is.
The good news was that the $32,000 line was providing the required support and January 26 was the fifth consecutive day for BTC staying above that mark. Buyers were hoping for a proper consolidation in that area, which combined with the slightly increased volumes will trigger a new green wave across the markets.
The mid-week session on Wednesday proved them wrong. Bitcoin corrected its price down to $30,408, but not before touching the 50-day EMA at $29,100 during intraday. It decreased by 6.4 for the day but avoided a daily close below the psychological level of $30,000.
As of the time of writing this, the BTC/USD pair is trading at $31,480 slightly up from yesterday. Bulls were rejected at $32,000 and the Fibonacci 23.60 in the morning.
Below is the 1-day chart.
ETH/USD
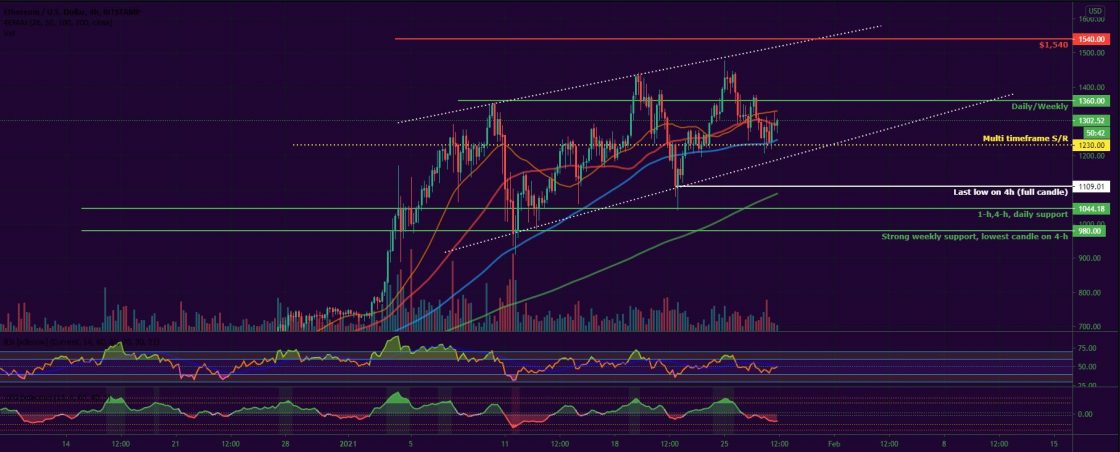
Unlike BTC, the ether was showing signs of serious strength in the last couple of weeks and days. The coin closed at $1,393 on Sunday, January 24, and continued to move upwards in a solid trend-supportive channel. It was 13 percent up on a weekly basis.
On Monday, the ETH token registered a new all-time high hitting the $1,476 mark in the morning part of the session. It was rejected at the upper limit of the channel and eventually fell down to $13,18, forming a red candle for the day.
The Tuesday session found bulls and bears fighting in the $1,230 – $1,360 zone. Even though the former managed to prevail, the $1,360 level was too strong of a resistance for them to surpass.
On Wednesday, January 27, the Ethereum token once again corrected its price, this time to $1,240. The move resulted in an 8.8 percent loss.
As of the time of writing, ether is trading at $1,297, up from the multi-timeframe support.
Below is the 4-hour chart.
Like BTCMANAGER? Send us a tip!
Our Bitcoin Address: 3AbQrAyRsdM5NX5BQh8qWYePEpGjCYLCy4


