Total crypto market cap lost $15 billion from its value since Monday morning and now stands at $213.4 billion. Top ten coins are all in red for the last 24 hours with Tezos (XTZ) and ether (ETH) being the worst performers with 13.2 and 11.2 percent of losses respectively. At the time of writing Bitcoin (BTC) is trading at $7,513 on the Bitstamp daily chart, while Ether (ETH) moved down to $173 and Ripple’s XRP fell to $0.191.
BTC/USD
Bitcoin nosedived to $8,027 on Sunday, March 8 in its worst session so far this year. It erased 9.7 percent of its value and was looking for a break of the important psychological level at $8,000.
Additionally, we saw both the 100 and 200-day EMAs being broken on the daily chart on March 8. The most popular cryptocurrency lost the mid-term trendline and the $8,200 – $8,400 support zone.
The BTC/USD pair continued to slide on Monday losing the $8k line. It moved down to $7,935 after trading as low as $7,634 during intraday.
We were looking at $7,700 as the next support area, mainly for two reasons. First, historically, it already proofed more than once to be a major S/R level. And second, BTC already broke below $7,800 on the first day of the week and it did not provide the expected stability.
On Tuesday, March 10, Bitcoin formed its fourth consecutive red candle on the daily chart and dropped down to $7,875. We witnessed a highly volatile session during which the leading cryptocurrency was trading in the $8,159 – $7,739 range.
The mid-week session on Wednesday was no different. BTC bears were in control and managed to push the price down to $7,600 in the early hours of the day. The coin recovered in the evening and entered positive territory to $7,941.
The leading crypto coin is trading at $7,500 by the time of writing, 5.5 percent lower on Thursday morning.
ETH/USD
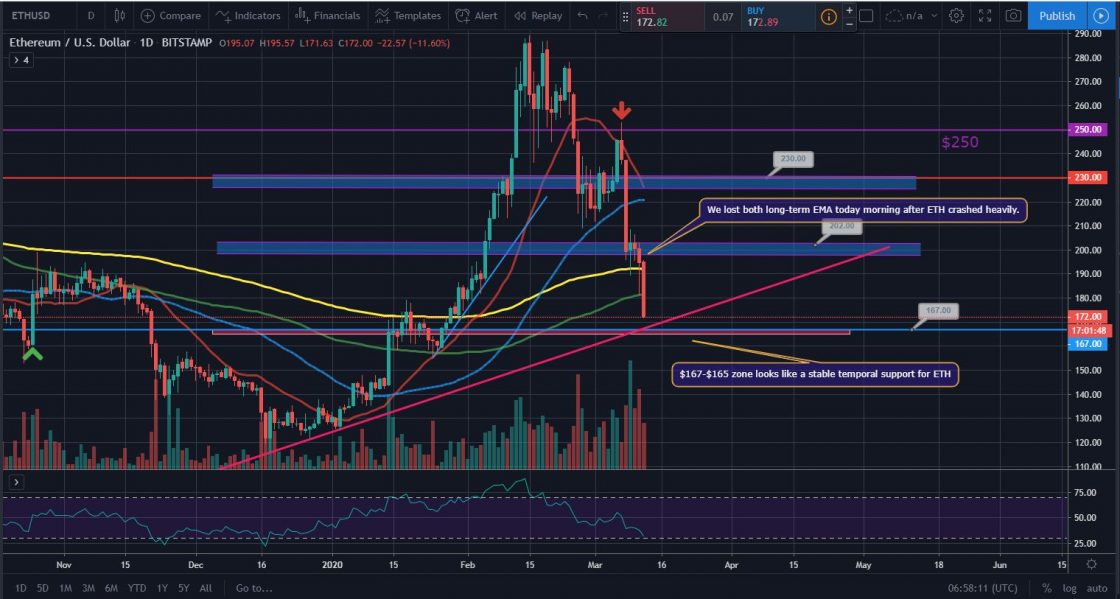
The Ethereum Project token ETH followed the general crypto market trend on Sunday, March 8 and crashed down to $200. The ETH/USD pair erased 15 percent of its value and closed the seven-day period with a 7.4 percent loss.
Bulls were already looking at the 200-day EMA for support in combination with the horizontal support in the $197-$202 zone. $202 is also in line with the 50 percent Fibonacci retracement level.
The leading altcoin started trading on Monday by ranging in the wide-area between $208 – $189. It closed the session with a small gain to $202.
On Tuesday, March 10, the ether made a step back and corrected its price to $200 on a relatively calm day on the market.
The mid-week session on Wednesday saw the coin moving once again into negative territory. It made a huge drop to $183 in the early hours of the day, also breaking below the long-term EMA. Bulls, however, managed to initiate a partial recovery and the ETH token closed with a small loss to $194.
As of the time of writing, the ETH/USD pair is trading at $173 or 10 percent lower.
Like BTCMANAGER? Send us a tip!
Our Bitcoin Address: 3AbQrAyRsdM5NX5BQh8qWYePEpGjCYLCy4


