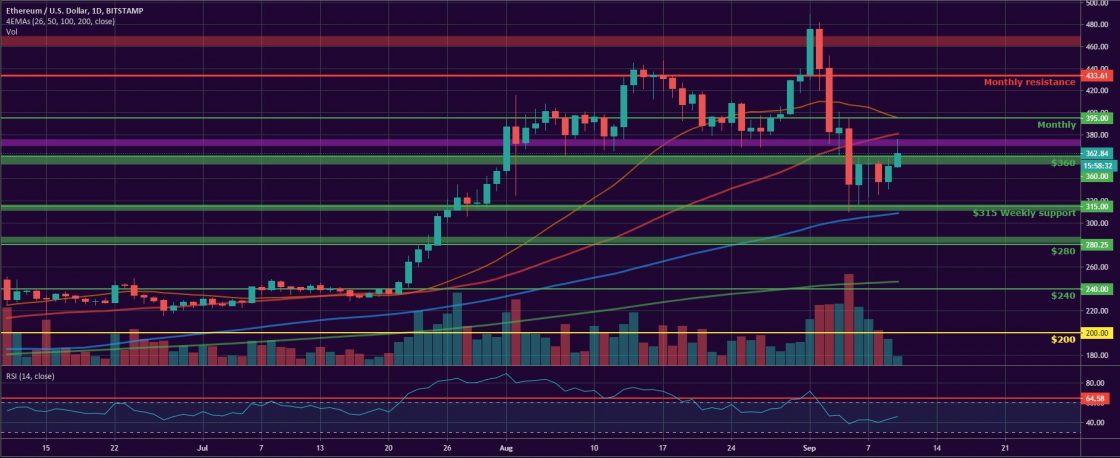
The total crypto market cap added $7.2 billion to its value since Monday morning and now stands at $335.2 billion. The top ten coins were mostly in green for the last 24 hours with ether (ETH) adding 6.7 percent to its value while Bitcoin SV (BSV) lost 2.2 percent. At the time of writing bitcoin (BTC) is trading at $10,286 on the Bitstamp daily chart, while the ether (ETH) climbed up to $363. Ripple’s XRP recovered to $0.244.
BTC/USD
Bitcoin closed the trading session on Sunday, September 6 by climbing up to $10,265. The leading cryptocurrency hit the 100-day EMA on the daily chart after testing the $10,000 horizontal support for the third consecutive day. The move resulted in 12.3 percent of price correction for the previous seven-day period.
On Monday, September 7, the BTC/USD pair continued to rise and successfully reached $10,375. The closely situated $10,360 mark was the previous 2020 high, so it can be considered a major S/R line. In the earlier hours of trading bitcoin temporarily fell below the mentioned $10k line, which proofed that bear pressure was still significant.
The trading day on Tuesday confirmed that statement as the coin dropped down to $10,127 loosing 2.3 percent while drawing a descending triangle formation on both the 4-hour and the daily chart.
The mid-week session on Wednesday, September 9 was a positive one for buyers as the price of BTC moved out of the mentioned figure and formed a green candle to $10,233 and also touched $10,360 during intraday.
The 24-hour volumes were moving decreased from $28 to $22 billion on average for the first three days of the workweek, temporarily jumping to $47 billion on various occasions.
ETH/USD
The Ethereum Project token ETH climbed up to $353 on Sunday, September 6 after rebounding from the weekly support zone near $315. The ether grew by 5.3 percent but still closed the previous week with an 18.4 percent loss.
The ETH/USD pair stabilized near the above-mentioned level on Monday and remained flat at the end of the session.
On Tuesday, September 8 sellers successfully pushed the price down to $337 not allowing it to break above the solid S/R zone at $360. The leading altcoin was now caught in the $360-$320 range, best visible on the lower timeframes (4-hour for instances for those looking for a price trigger to trade on the daily chart).
The third day of the workweek brought another upward movement for ETH as it climbed up to $352. Even though it could mark the beginning of a price recovery, the current setup also has the potential to evolve into a bearish rising wedge formation after the big selloff on September 5. The pattern could lead to another re-test of the $315 level in the coming days. Further pullback can be supported by the red wave hitting the legacy markets.
Like BTCMANAGER? Send us a tip!
Our Bitcoin Address: 3AbQrAyRsdM5NX5BQh8qWYePEpGjCYLCy4


