Total crypto market cap lost $2.3 billion of its value since Monday morning and now stands at $371.2 billion. Top ten coins were all in red for the last 24 hours with Bitcoin Cash (BCH) and ChainLink (LINK) being the worst performers with 10.5 and 11 percent of loses respectively. At the time of writing bitcoin (BTC) is trading at $11,382 on the Bitstamp daily chart, while the ether (ETH) continued to slide and reached $437. Ripple’s XRP moved down to $0.276.
BTC/USD
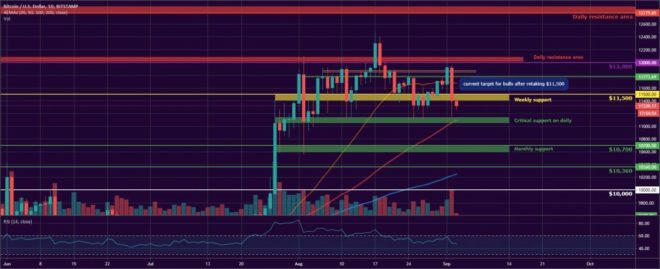
Bitcoin moved up to $11,706 on Sunday, August 30 and hit the 26-day EMA on the daily chart. The coin successfully rebounded from the horizontal support at $11,500 and closed the seven-day period with a 0.5 percent loss.
The BTC/USD pair started trading on Monday by hitting $11,770 during intraday. The level was a stable resistance in the beginning of August and was seen by many as the next target in front of bulls in order to re-ignite the upward movement. Still, the momentum was not strong enough and the price was rejected, falling to $11,650.
Bitcoin closed the month of August with a 2.5 percent increase.
The trading session on Tuesday, September 1 was a positive one for the most popular cryptocurrency. It skyrocketed to $11,930, smashed through the horizontal resistance and even hit $12,000 during intraday. The coin added 2.4 percent to its value.
The third day of the week came with a solid correction. Bitcoin fell down to $11,393, which resulted in a 4.5 percent pullback. The major horizontal support at $11,500 was broken which opened the door for a test of the $11,150 – $11,100 area.
The trading volumes increased from $20 billion on Monday to $26 billion on Wednesday afternoon.
ETH/USD
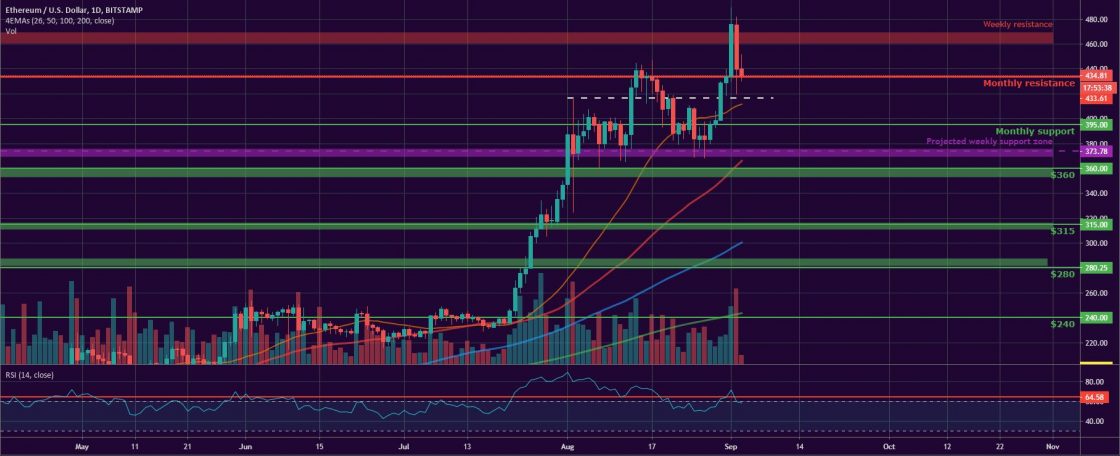
The Ethereum Project token ETH moved up to $429 on Sunday, August 30 after trading below the $415 line for ten days straight. It added 7.7 percent to its value and closed the week 5 percent higher.
The leading altcoin continued to raise on Monday, August 31, and reached the monthly resistance line at $434. The coin was 25 percent up on a monthly basis as bulls were already looking to registered a new year to date high.
On Tuesday, the ETH/USD pair formed a big green candle and closed at $476 for the first time since July 2018. The price broke right above the solid high timeframe resistance zone between $470-$460.
The mid-week session on Wednesday, however, proved that bulls were already losing momentum due to the rapid increase and the profit-taking activities combined with the strong technical resistances resulted in a heavy drop. ETH dropped to $439 and erased 7.7 percent of its value for the day. Bears were even able to push the price down to $416 during intraday – the next stop downwards if the monthly resistance at $434 fails to turn into support.
In terms of trading volumes, they started to pick up pace on Monday and climbed from $11 billion to $18 billion on Wednesday evening.
Like BTCMANAGER? Send us a tip!
Our Bitcoin Address: 3AbQrAyRsdM5NX5BQh8qWYePEpGjCYLCy4