Bitcoin had a major breakout last night, taking the asset to a price well above $20,000 to close out what has been a stellar year for the cryptocurrency.
Although 2020 was a monumental year for many reasons, it also marks a milestone for Bitcoin, in which a record has been set for the longest weekly uptrend in the asset’s history, according to a “parabolic” indicator.
Will Bitcoin Go Parabolic Following Longest Weekly Uptrend In Crypto History?
Although there have been very few full market cycles in cryptocurrencies, there have been at least three bull runs, and a pair of extended bear phases. The second bearish phase has only recently ended, leaving very little to look back at for comparison’s sake.
But what is obvious based on the repeating patterns, is that once Bitcoin breaches its former all-time high, the asset goes parabolic for nearly a year thereafter.
Related Reading | Bitcoin Consolidation At ATH: Expect Shake Outs, Traps, & More Before Next Leg
The resulting uptrends are the most powerful impulses on the asset’s price chart and deliver a proven ROI of between 2,000 and 5,000% across the two previous parabolic phases.
The third time is already proving to be the charm, with Bitcoin already setting a record for the longest weekly uptrend in its 12 year history, according to the Parabolic SAR indicator. What’s also notable, is that this feat has been achieved following the Black Thursday collapse, during one of the most unprecedented years yet, and did it before a new record was even set.
Is Bitcoin about to go parabolic? And what else does the Parabolic SAR indicator tell us?
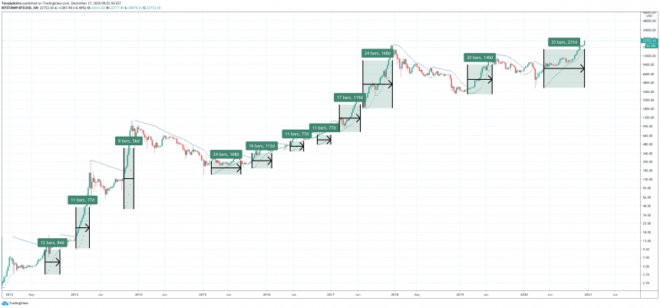
A new record is set for the longest weekly positive string of SAR | Source: BTCUSD on TradingView.com
Understanding The Parabolic Stop And Reverse Technical Indicator
Bitcoin is expected to enter a parabolic phase any day now and might have already done so considering just how strong the uptrend has been thus far. But the Parabolic SAR indicator itself isn’t used to decipher if and when that happens. It instead, however, can help understand if and when that parabola has been broken.
In the chart above, the Parabolic SAR depicts the largest strength of weekly positive “SAR” under the price action. This string of bullish momentum has lasted over 200 days. The next longest uptrend on weekly scales was the 2017 rally that took the asset to $20,000 the first time.
Related Reading | Gold Naysayer Turns To Bitcoin: Overpriced, Model Says Max Value $74K BTC
The indicator itself is among the most straightforward to use, but the uses themselves vary. When price action passes through a SAR dot and closes, it is a signal that the trend has sufficiently reversed, and the parabola has been broken.
Note that in the chart above, the most recent trend change took place during the Black Thursday selloff, but it’s been nothing but incline since.
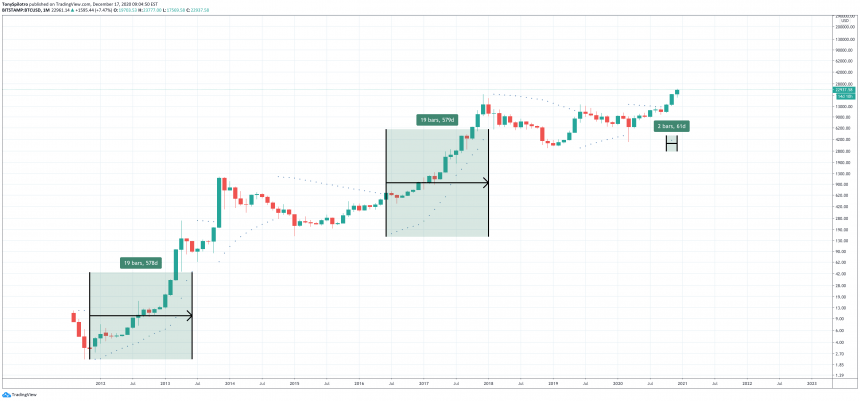
Monthly timeframes suggest the uptrend just started | Source: BTCUSD on TradingView.com
Traders can utilize the Parabolic SAR indicator, developed by J. Welles Wilder, Jr., as part of a trailing stop strategy where a stop loss is moved up or down along with each SAR dot. The idea here is that if and when the stop is hit, it will be hit in profit at a point where the trend had already reversed anyway.
The tool’s creator also designed the Average Directional Index, Average True Range, and Relative Strength Index. The tool suggests that although the weekly uptrend has already been record-breaking, monthly timeframes show that things are only just now getting started.
Featured image from Deposit Photos, Chart from TradingView.com


