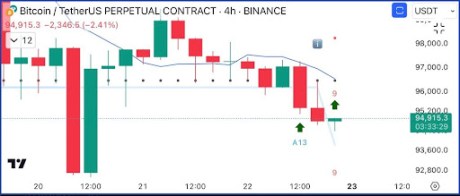
Bitcoin Price Key Highlights
- Bitcoin price is in the middle of a larger correction to the area of interest previously highlighted.
- If support holds, bitcoin could recover to the Fibonacci extension levels marked on the 4-hour time frame.
- Technical indicators appear to be suggesting that there’s still a chance for bulls to charge at these levels.
Bitcoin price is making a deeper correction from its earlier rally, and technical indicators suggest that the climb could resume.
Technical Indicators Signals
The 100 SMA is safely above the longer-term 200 SMA to confirm that the path of least resistance is to the upside. This basically means that it’s more likely for the uptrend to resume than to reverse. However, bitcoin price is below the 200 SMA dynamic inflection point to signal weaker bullish pressure.
Price is still within the area of interest or former resistance around $6,800 to $7,000, which might hold as support from here. A rising trend line can also be drawn to connect the lows since the third week of July.
RSI is already turning higher after indicating oversold conditions and showing a bit of bullish divergence. This means that buyers are ready to return and push bitcoin price back up. The 38.2% extension is near the 100 SMA dynamic inflection point at $7,826 then the 61.8% extension lines up with the swing high near $8,500.
Stronger bullish momentum could take bitcoin price up to the 78.6% extension at $8,827 or the full extension at $9,357. Stochastic is also starting to climb out of the oversold region, also indicating a pickup in buying pressure.
BTCUSD Chart from TradingView
Bitcoin price took some hits after Starbucks clarified that it is not accepting bitcoin payments in stores, even after partnering with ICE for a digital platform called Bakkt. Traders could continue to hold out for the next set of major updates to determine whether a bounce or a break is due at these levels.


