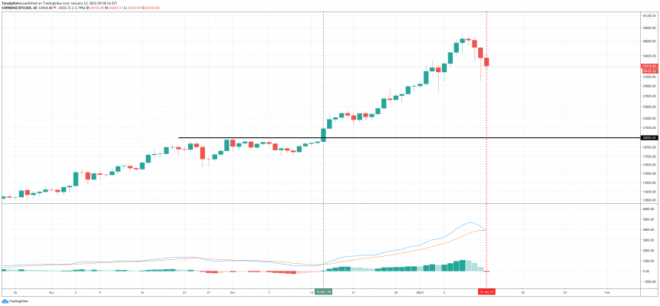
Bitcoin yesterday saw its largest daily red candle in its history in terms of total dollars moved. Today, the selling has continued, and it has caused the MACD to turn bearish for the first time since the leading cryptocurrency by market cap took out $20K.
Is this a sign of a short term reversal, or is the top of the bull market already here? Here’s what the Moving Average Convergence Divergence indicator says about the recent price action in crypto.
Have Bitcoin Bears Regained Control Of The Top Cryptocurrency?
Bitcoin started off the year with among its sharpest weekly advances yet, taking the asset from under $30K to above $40K. The rounded number more than double its former peak posed the first resistance for the asset since the breakout from $10,000.
The rally began, and Bitcoin never turned back – at least until now. Although bulls have been in control for months now, hidden bears attacked above $40,000 and sent the cryptocurrency tumbling by over $10,000.
Related Reading | Bitcoin Bloodbath: How The Dollar Turned A Sea of Green Red
Yesterday set the record for the worst daily close in the asset’s short, twelve-year history. The fallout could have changed the bull trend bearish and brought fear back to the otherwise overly exuberant crypto market.
The selling has since continued, but bulls are keeping prices at bay currently and price is consolidating. The selloff however was enough to turn the MACD red on the histogram for the first time on daily timeframes since $20K was taken out.
The daily MACD has turned red on the histogram for the first time since $20K | BTCUSD on TradingView.com
Short-Term Trend Turns Bearish, But Weekly And Monthly Momentum Remains Up
The Moving Average Convergence Divergence indicator is a trend-following, momentum-measuring tool consisting of two moving averages that converge and diverge. Because of the way it works, it is often disregarded by analysts as a “lagging” indicator.
Bitcoin’s MACD histogram only now flipping bearish following a nearly $10,000 selloff demonstrates this lag, but that doesn’t discount its efficacy. Crossovers of the two MACD lines can act as a confirmation signal that solidifies that the trend is changing.
Related Reading | Bitcoin Uptrend From $20K Has Been Lost According To Parabolic Indicator
And because the MACD focuses on momentum and recently became so elevated, the eventual correction will have more gravity to it. The histogram turning red on daily timeframes, unless bulls can uncross the two moving averages, could extend for days to come.
However, it is important to note that like any technical analysis indicator, more weight is given to higher timeframes, and on weekly and monthly timeframes that count the most, the momentum is still pointing upward overall.
To use the MACD effectively on the way back up, a confirmation the daily bull trend has resumed would arrive with a crossover of the moving averages to the upside.
Featured image from Deposit Photos, Charts from TradingView.com


