
The total crypto market cap lost $8.3 billion from its value for the last seven days and now stands at $365.6 billion. The top 10 currencies were all in red for the same period with ChainLink (LINK) and Bitcoin SV (BSV) being the worst performers with 17.2 and 11.9 percent of losses respectively. By the time of writing bitcoin (BTC) is trading at $11,700 while ether (ETH) moved up to $394. Ripple’s XRP recovered to $0.287.
BTC/USD
Bitcoin closed the trading session on Sunday, August 16 at $11,910 confirming the newly established weekly high. The coin was also 2.5 percent up on a weekly basis.
On Monday, August 17, the BTC/USD pair formed a solid green candle to $12,300 on the daily chart and stormed pass the psychological horizontal resistance at $12,000. It added another 3.2 percent to its value as bulls were already looking at the zone below $14,000 as their next target.
The trading day on Tuesday, however, was a wakeup call for them. The leading cryptocurrency dropped back to the sub-$12k area and erased all gains from the previous session. Still, the coin was trading above all major moving averages and the monthly and weekly support levels.
The mid-week session on Wednesday saw bitcoin trading as low as $11,560 during intraday, just to recover in the evening closing with a small loss to $11,750. Bear pressure was increasing, but the general uptrend was still intact.
On Thursday, August 20, the BTC/USD pair broke the local downtrend and successfully formed a small green candle up to $11,858.
The Friday session, however, was not that positive for bulls and BTC suffered a hard drop right to the weekly support near $11,500, also moving below the short 26-day exponential moving average. This resulted in a 2.7 percent correction.
The weekend of August 22-23 started with a continuation of the downward to $11,363 on Saturday morning before bitcoin was able to recover in the evening and register a small increase to $11,666.
On Sunday, it once again re-tested the weekly support but was rejected there closing the day at $11,631.
The 24-hour trading volumes increased to $25 billion for the first three days of the week compared to $19 billion on average for the previous week then slightly decreased on Thursday, remaining in the $20-$23 billion range until Saturday. On Sunday, August 23, they fell, even more, reaching $17 billion.
ETH/USD
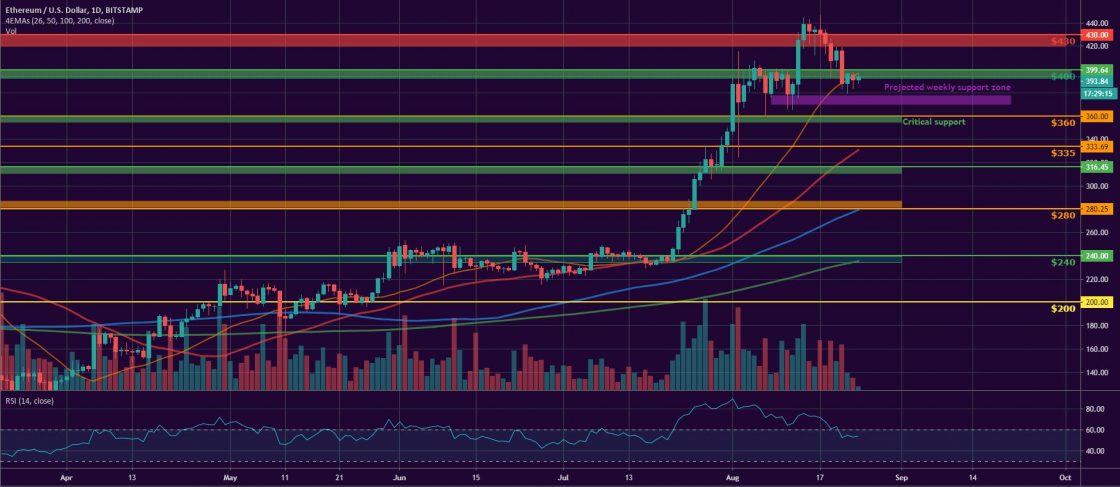
The Ethereum Project token ETH was quite volatile on Sunday, August 16, and fell as low as $412 during intraday after peaking at $438 the previous day. Still, the leading altcoin closed the week at $434 with a 10 percent increase for the period.
On Monday, the ETH/USD pair was trading in the wide range between $447-$421 before dropping to $430 at the end of the session.
Then on Tuesday, August 18, the ether formed a big red candle and corrected its price down to $422.
The move was followed by a third-consecutive red session on the daily chart and the coin continued to slide on Wednesday reaching $407. This resulted in a 3.6 percent pullback. Bears were even able to push the price all the way down to the lower end of the $400-$390 horizontal support.
On Thursday, August 20, the ETH/USD pair climbed up to $416 breaking the short-term downtrend, but the zone between $430-$420 was now acting as resistance in front of bulls, and they were rejected at its lower boundary.
The last day of the workweek came with a huge drop to $387 – the horizontal support was lost and the ETH dropped another 7 percent.
The next target in front of bulls was to defend the weekly support and that is what they did on Saturday when the ether first hit $380 during intraday then rebounded and formed a small green candle to $396.
On Sunday, it made another step down to $390, still gravitating around the horizontal support.
XRP/USD
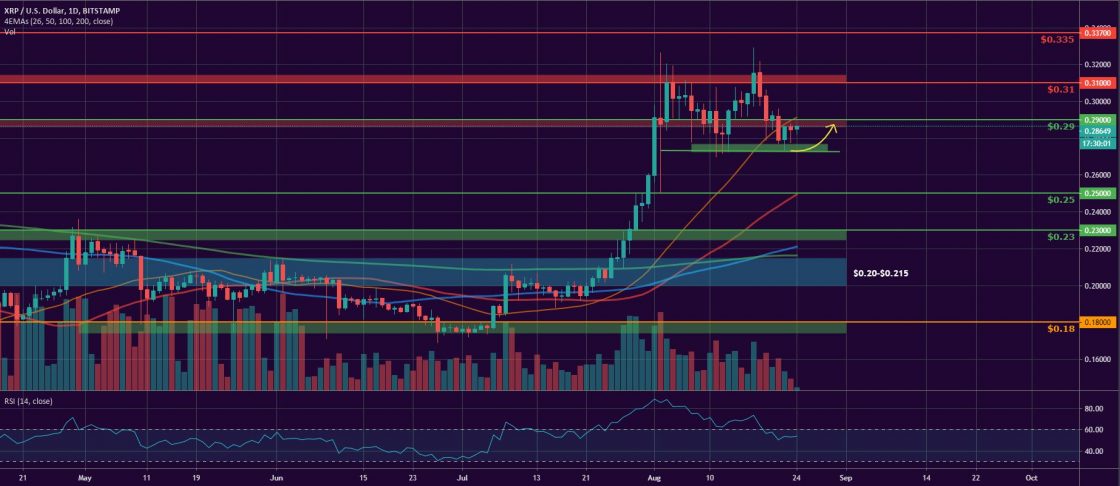
The Ripple company token XRP moved up to $0.304 on Sunday, August 16, and closed the previous week 5.9 percent up. The coin remained stable and close to the $0.29 horizontal support and was now targeting the zone above $0.31.
On Monday, August 17, the XRP/USD pair continued to impress and formed a green candle to $0.315, but not before hitting $0.328 during intraday, which corresponded to a 3.6 percent price increase.
The trading session on Tuesday, however, was the beginning of a pullback for the major altcoin. It moved down to $0.302 after suffering a rejecting near the $0.32 level.
The mid-week session on Wednesday found XRP sliding further down. It hit the 26-day EMA at $0.279 in the early hours of trading, but managed to partially recover in the evening hours and closed right at the $0.29 support. Still, the drop resulted in a 4 percent loss.
On Thursday, August 20, bulls finally found some breathing space and stabilized around the above-mentioned level.
Then on the last day of the workweek, we witnessed a break of the support line as the “ripple” continued to lose ground. It closed at $0.279.
The weekend of August 22-23 started with a short green candle to $0.286 on Saturday, which was followed by a red one to $0.284 on Sunday. The XRP now found a temporary support level near $0.275.
Altcoin of the Week
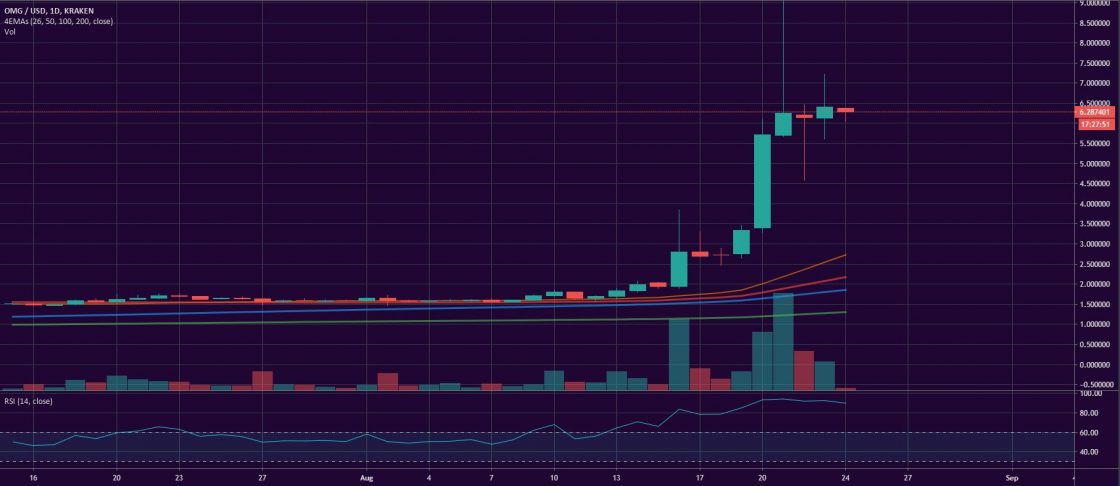
Our Altcoin of the week is without a doubt the rebranded OmiseGo (OMG) token, which is now known as OMG Network. The coin added 231 percent to its value for the last seven days and is 300 percent up for the two-week period.
OMG peaked at $8.12 on Friday, August 21, and is now ranked at #27 on the CoinGecko’s Top 100 list with a market capitalization of approximately $904 million.
We don’t know what is driving the OMG price up, but on August 19, Tether, the company behind USDT announced its token integration with the OMG Network, which is aimed at reducing transaction costs and improve overall performance, so this might be a causing the coin to surge in the recent days.
As of the time of writing, OMG is trading at $6.28 against USD on Kraken.
Like BTCMANAGER? Send us a tip!
Our Bitcoin Address: 3AbQrAyRsdM5NX5BQh8qWYePEpGjCYLCy4