The total crypto market cap added $8.8 billion to its value for the last seven days and now stands at $373.1 billion. The top 10 currencies were mostly in green for the same period with Polkadot (DOT) being the best performer with 50.3 percent of gains while Cardano (ADA) lost 4.8 percent. By the time of writing bitcoin (BTC) is trading at $11,667 while ether (ETH) surged to $423. Ripple’s XRP stabilized near $0.282.
BTC/USD
Bitcoin once again re-tested down the weekly support at $11,500 on Sunday, August 23, but suffered yet another (third consecutive) rejection there. The leading cryptocurrency closed the week at $11,631, with a 5.3 percent loss for the period.
The BTC/USD pair opened trading on Monday by moving up to $11,758. The coin, however, faced its first trouble area near the previously stable mid-term uptrend support line, now turned resistance (in white on our chart and better seen on the 4-hour graph). Additionally, the next horizontal resistance on the daily chart was situated just a step away – at $11,800.
On Tuesday, August 25, BTC made a sharp drop to $11,328 and erased another 3.6 percent of its value. Bears were even able to push the price as low as $11,100 during intraday – the zone we consider critical in terms of keeping the uptrend intact.
The mid-week session on Wednesday was a positive one for buyers and bitcoin formed a short green candle to $11,468. On the negative side of things, the price was rejected on its way to break above the $11,500 horizontal level, which confirmed its importance in the current setup.
On Thursday, August 27, BTC/USD made a similar move, but in the opposite direction. It dropped to $11,300 and continued to be caught in the $11,500-$11,300 area.
The Friday session was no different and the price of BTC once again climbed to $11,500. It was obvious that neither bulls nor bears were able to take over control and establish a trend.
The weekend of August 29-30 started with yet another drop to the above-mentioned area. This time bitcoin stopped at $11,460.
The next big target in front of bulls was to re-take the previously important weekly high at $11,500 and make sure the price of their preferred cryptocurrency remains above $10,700 at the end of the month.
On Sunday, the coin rebounded from the horizontal support and climbed all the way up to $11,718.
ETH/USD
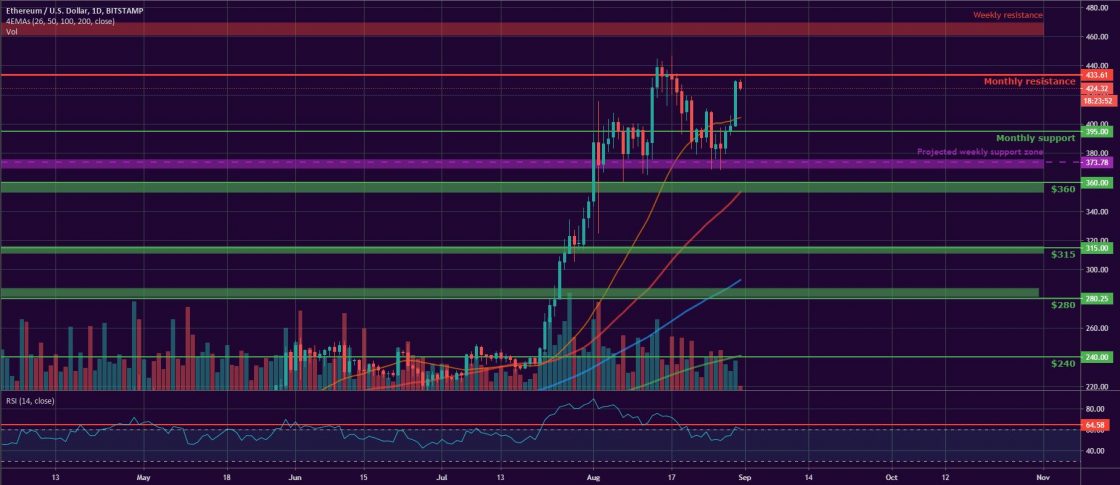
The Ethereum Project token ETH made another step down to $390 on Sunday, August 23, but still continued to gravitate around the horizontal support zone ($400-$390).
The coin was 10 percent down on a weekly basis.
The ether opened the new trading period on Monday by moving up to $409 in its biggest one-day increase since August 13. This resulted in a 4.6 percent increase as the mentioned horizontal line was successfully surpassed.
On Tuesday, August 25 the ETH dropped down to $383, erased 6.3 percent of its value and even touched the lower end of the support zone on the weekly chart at $370 during intraday.
The Wednesday session found the coin moving in the $393-$376 range just to end up forming a short green candle to $386.
On Thursday, August 27, the ETH/USD pair was quite volatile. It was moving in the $370-$400 range before closing with a small loss to $383.
The last day of the workweek marked the return of bulls. The biggest altcoin climbed up to $395 and once again entered the previously stable support area.
The ether confirmed the upward movement on the first day of the weekend and stopped at $398 at the end of the session. Then on Sunday it made a huge green candle up to $428 and added 7.5 percent to its value.
XRP/USD
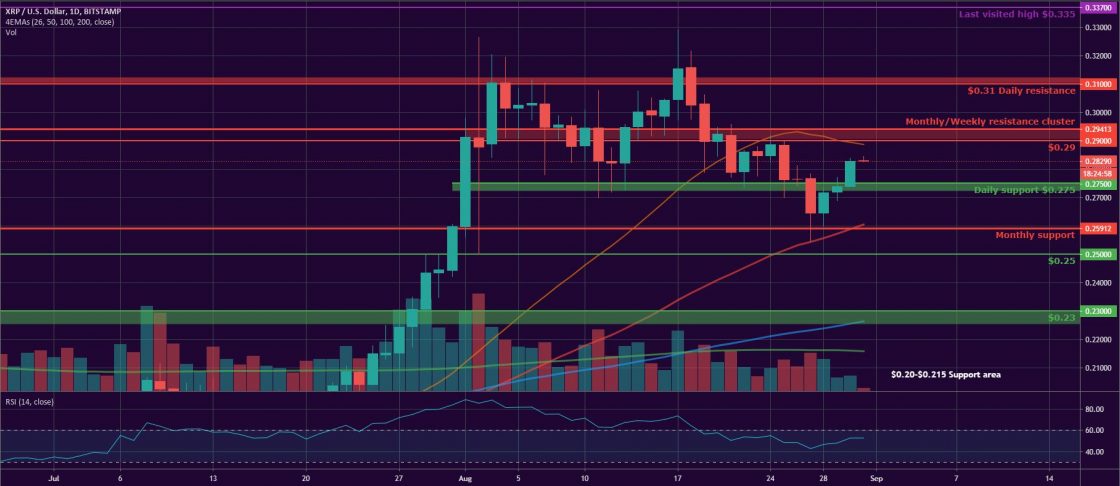
The Ripple company token XRP formed a short red candle to $0.284 on Sunday, August 23. It managed to find temporary support near the $0.275 horizontal line, but still closed the seven-day period with a 6.5 percent loss.
On Monday, the XRP/USD pair opened the new trading week by once again testing the $0.29 resistance line. The move was followed by yet another rejection, but bulls were able to push the price up to $0.288 at the end of the session.
On Tuesday, August 25, the “ripple” dropped down to $0.276 and again it was the horizontal support that provided the required stability.
We witnessed a low-volatility session on Wednesday, during which the coin remained flat and attempted to consolidate around the mentioned level.
On Thursday, August 27, however, it continued to slide instead and reached $0.264. The price of XRP even touched the 50-day EMA at $0.254 in the early hours of trading, proving that the bear pressure was rapidly increasing.
The last day of the workweek came with a solid green candle to $0.271 and a temporary reversal in the short-term trend, but the major altcoin continued to be situated below the important support area.
It made slight progress on Saturday, August 29 climbing up to $0.273. Then on Sunday, the XRP token continued to surge and closed the week at $0.283.
Altcoin of the Week
Our Altcoin of the week is UMA (UMA). UMA, which stands for Universal Market Access, is a decentralized finance platform aimed at bringing traditional financial derivatives to the blockchain by using synthetic tokens solution.
The altcoin rose by 141 percent last week and moved up to #32 on the CoinGecko’s top 100 list with a total market capitalization of $813 million. UMA peaked at $15.87 on Sunday, August 30 and registered the stunning 267 percent of increase on a monthly basis.
The coin is most probably benefiting from the DeFi coins popularity and its yield farming Yield Dollar instrument (yUSD) whose zero-coupon bond yUSD-SEP20 will settle at $1 on September 1.
As of the time of writing, UMA is trading at $18.2 against USDT on Bitfinex.
Like BTCMANAGER? Send us a tip!
Our Bitcoin Address: 3AbQrAyRsdM5NX5BQh8qWYePEpGjCYLCy4


