The total crypto market cap lost $8 billion of its value over the last seven days and now stands at $246.3 billion a time of writing. The top 10 currencies showed mixed results for the same time frame with Bitcoin Cash (BCH) and Stellar (XLM) gaining 9.9 and 6.3 percent respectively while Bitcoin SV (BSV) lost 10.3 percent. By the time of writing bitcoin (BTC) is trading at $9,137 while ether (ETH) dropped to $180. Ripple’s XRP is trading around $0.29
BTC/USD
Bitcoin formed its third consecutive green candle on the daily chart on Sunday, October 27, and moved up to $9,550 closing the 7-day period with a 16.5 percent of increase.
The BTC/USD pair opened the new trading period on Monday with a slight correction. It erased 3.4 percent of the total capitalization and dropped to $9,222 even though bulls were able to push the price up to $9,946 during intraday.
On Tuesday, October 29, the coin recovered from the loses registered during the previous session and closed at $9,420. It was already obvious that neither bulls nor bears were able to for a definitive trend and the levels near $9,000 will be crucial for the mid-term.
The mid-week session on Wednesday was no different as sellers temporarily took over control, bringing the most popular cryptocurrency back down to $9,154. This time, however, they were able to briefly break below the $9,000 support.
Bitcoin was quite volatile on Thursday and was trading in the $9,444 – $8,958 range. Surprisingly, we saw almost no change in price as it only lost a few dollars to stop at $9,148.
The coin was 11 percent up in October and successfully formed its first green candle on the monthly chart since June.
Bulls reminded for themselves on Friday, November 1, and the BTC/USD pair climbed up to $9,246. The move was followed by another winning session on Saturday, November 2 when the most popular digital currency closed at $9,305.
On Sunday, November 3, bitcoin made another step-down and closed the day and week at $9,204, with 3.4 percent of loses for the 7-day period.
ETH/USD
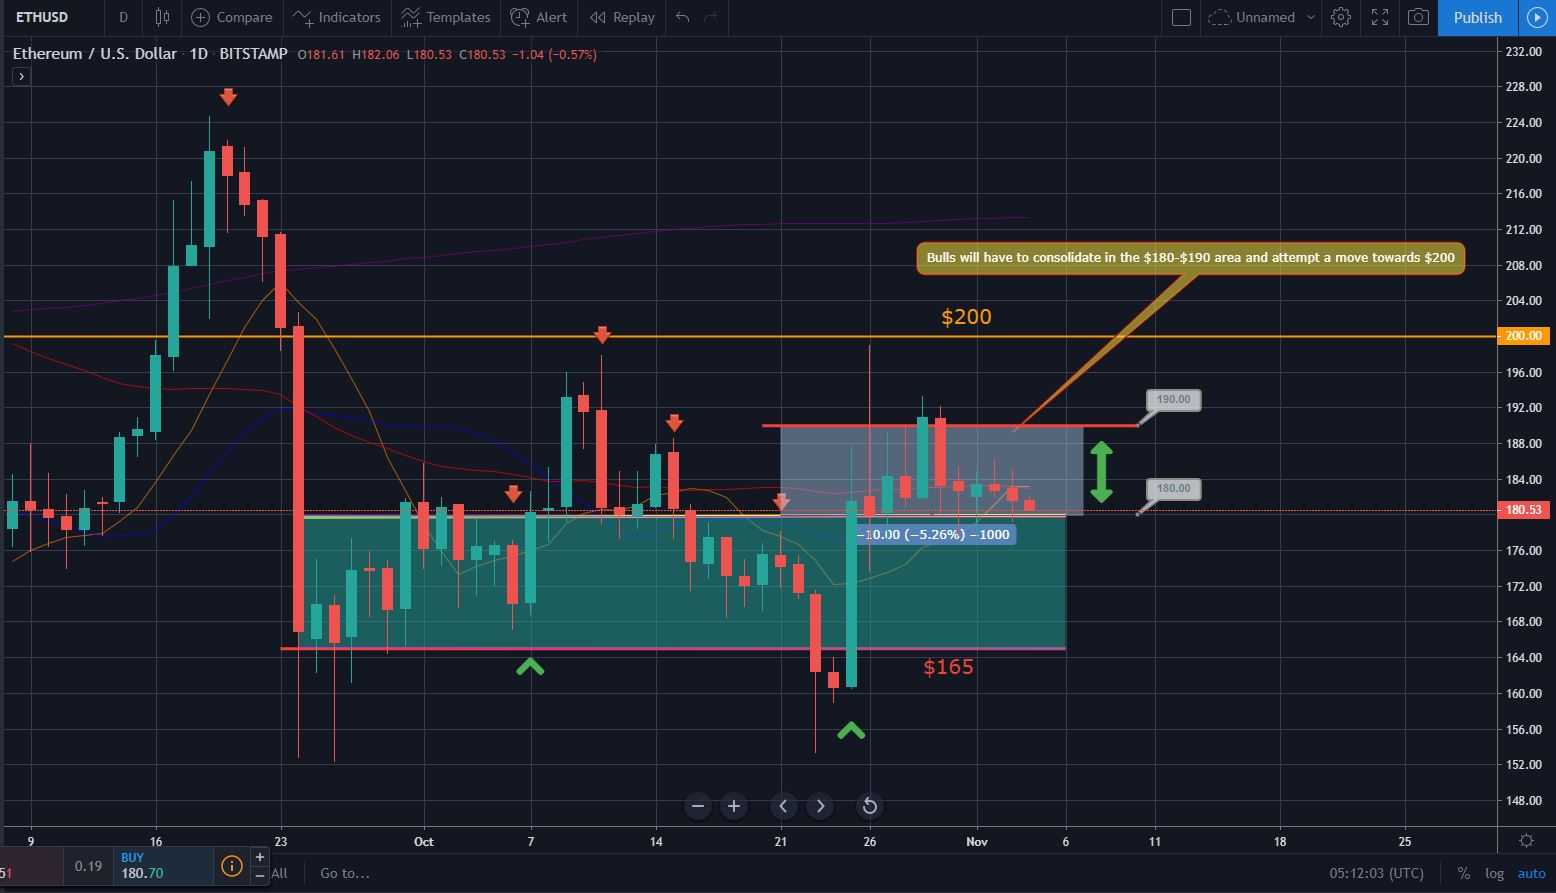
The Ethereum Project token ETH broke above the critical level of $180 on Sunday, October 27, and closed the day and the week at $184 or 5 percent higher compared to the previous 7-day period.
It peaked at $190 on Monday, October 28, but still ended the session with a small loss to $182 under bear pressure.
On Tuesday the ETH/USD pair added 4.3 percent to its value and climbed up to $190, successfully defending the $180 support. The next target for bulls was to surpass and hold $190 in order to confirm the mid-term uptrend.
On Wednesday however, the ether formed a similar red candle on the daily chart completely erasing its gains from the previous session. It closed at $183 while touching the $180 mark during intraday.
The last day of October found ETH falling down to $177 in the early hours of the day as bears were slowly starting to take over control. The coin eventually closed at $182 and added 2 percent to its value on a monthly basis.
November started with another high volatility session during which the ether was moving in the $185 – $177 zone. Bulls managed to partially recover and ended the workweek at $183.5.
The weekend of November 2-3 started with a small drop to $182.6. On Sunday, November 3, the ETH continued its way downwards and stopped at 181.6 losing 1.5 percent on a weekly basis.
XRP/USD
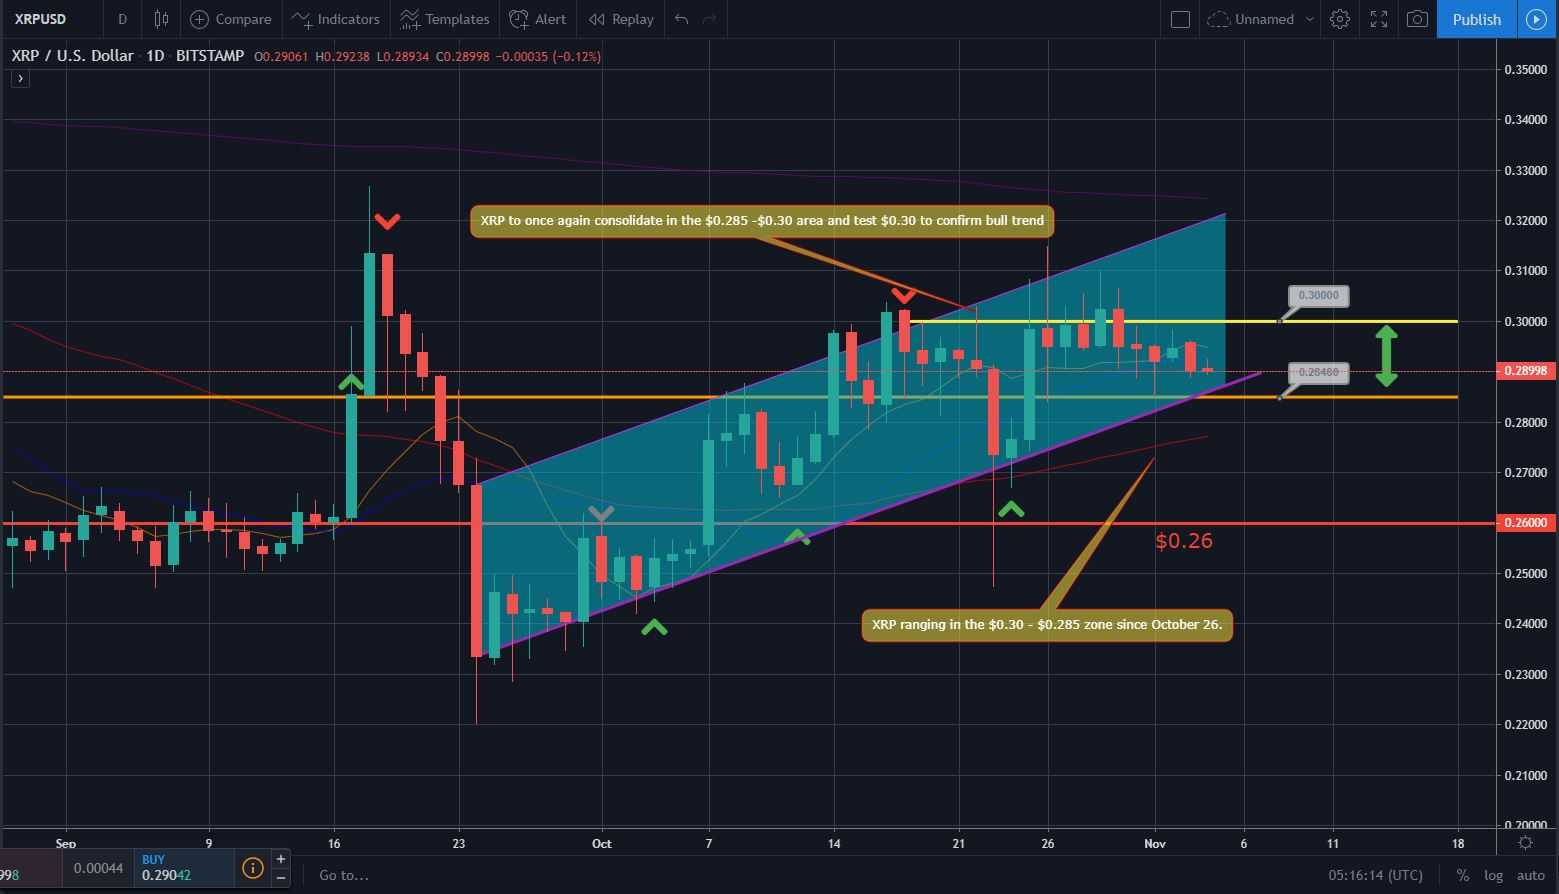
The Ripple company token XRP regained its positions near the $0.30 level on Sunday, October 27 and closed the previous week at $0.299, with 1.8 percent of increase.
It opened the new trading period by moving up to $0.305 during intraday, successfully breaking the above-mentioned support zone. Bears, however, were fast to react and pushed the price back down to $0.294, erasing the recent gains.
On Tuesday, October 29, the XRP/USD pair climbed up to $0.302 after touching $0.31 earlier in the day.
The exact same candle but in the opposite direction was formed on the mid-week session on October 30 as the XRP fell down to $0.294. Bulls and bears were struggling to hold to their gains and were not able to consolidate properly in order to establish a definitive trend.
We saw the coin trading in the $0.298 – $0.291 zone on Thursday, October 31. It formed another red candle on the daily chart and closed the month at $0.294 or 14.3 percent higher compared to the previous 30-day period.
The last day of the workweek and first day of November came with a third consecutive losing session for XRP. It dropped to $0.291 after touching $0.285 during intraday.
The latest move by the coin suggested we could be seeing a return of bears at least in the short-term.
The weekend of November 2-3 started with a small increase to $0.294, while on Sunday, November 3 we witnessed yet another push by bears, this time to $0.29. The XRP lost 2 percent of its value during the week.
Altcoin of the Week
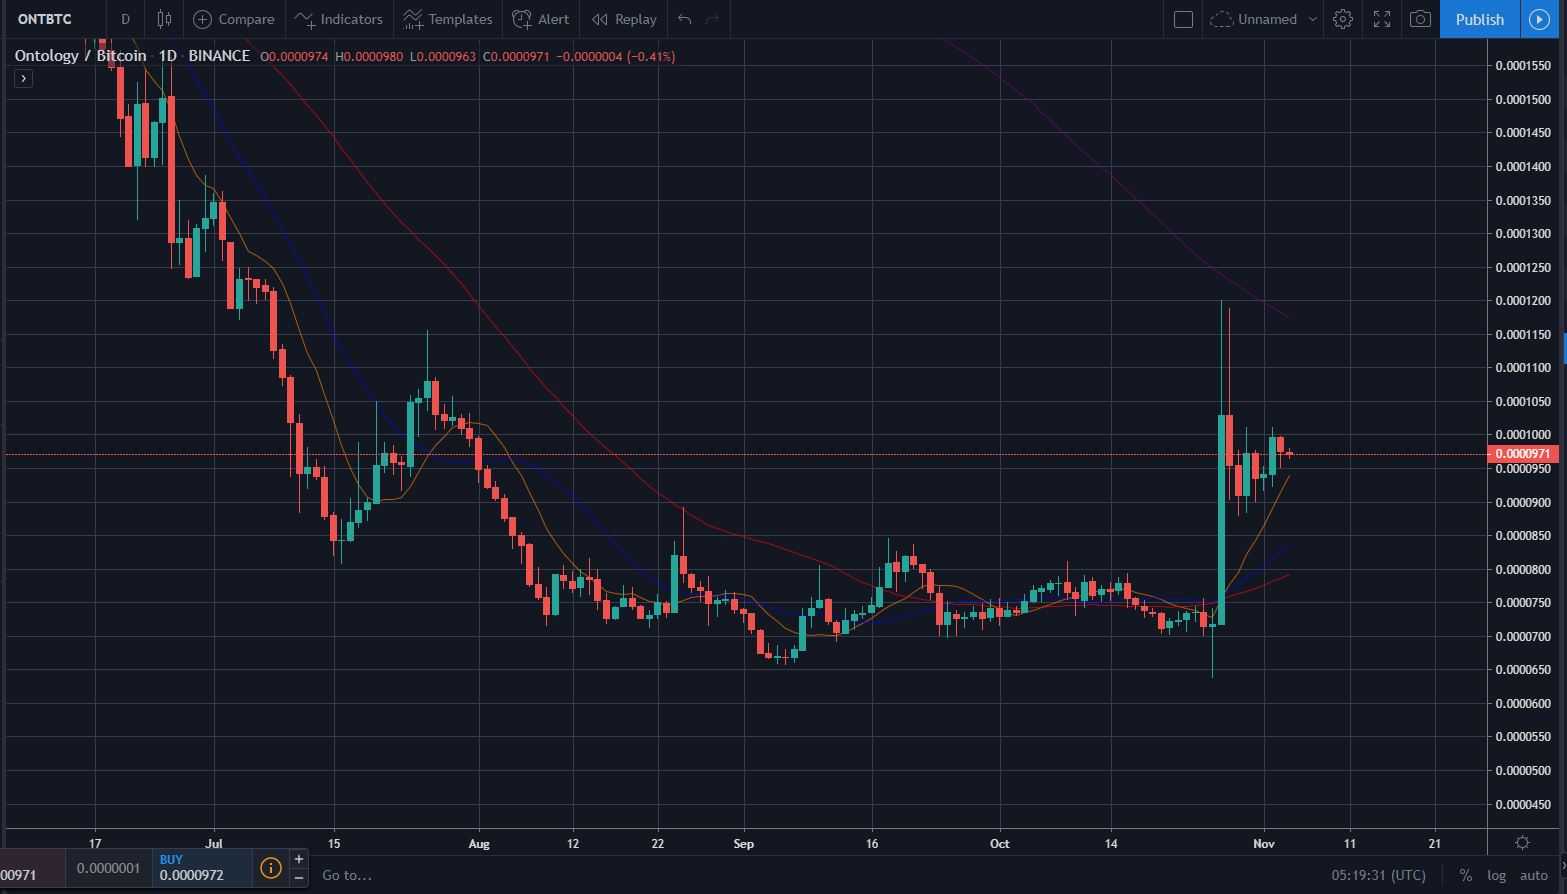
Our Altcoin of the week is Ontology (ONT). The decentralized business network environment was 35 percent up for the last seven days and 52 percent for the two week period.
Ontology is a China-based project created in 2017 by Erik Zhang and Da HongFei, also founders of the NEO blockchain. The ONT coins were never distributed during Initial Coin Offering (ICO) but were airdropped to NEO holders instead.
The ONT coin peaked at $1,10 on October 28 and now stands at #23 on the CoinGecko Top 100 list with a total market capitalization of approximately $603 million.
The most probable reason for the recent surge is the pro-blockchain rhetoric by Chinese authorities and the reemerged interest in the technology from the Asian country.
The project leaders also released their monthly update on October 31 outlining the recent technical progress and the most important development.
As of the time of writing, the ONT is trading at 0.0000971 against BTC on the Binance daily chart.
Like BTCMANAGER? Send us a tip!
Our Bitcoin Address: 3AbQrAyRsdM5NX5BQh8qWYePEpGjCYLCy4


