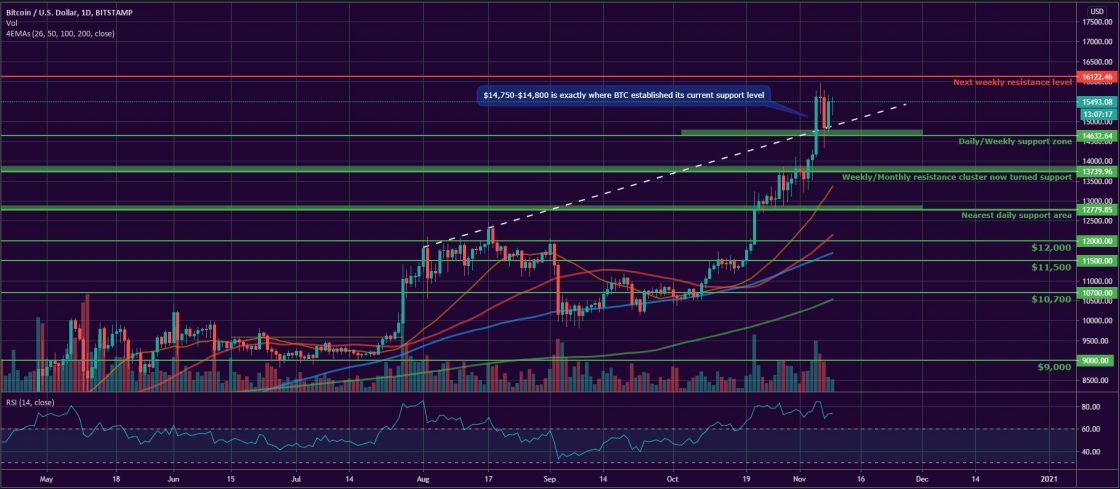
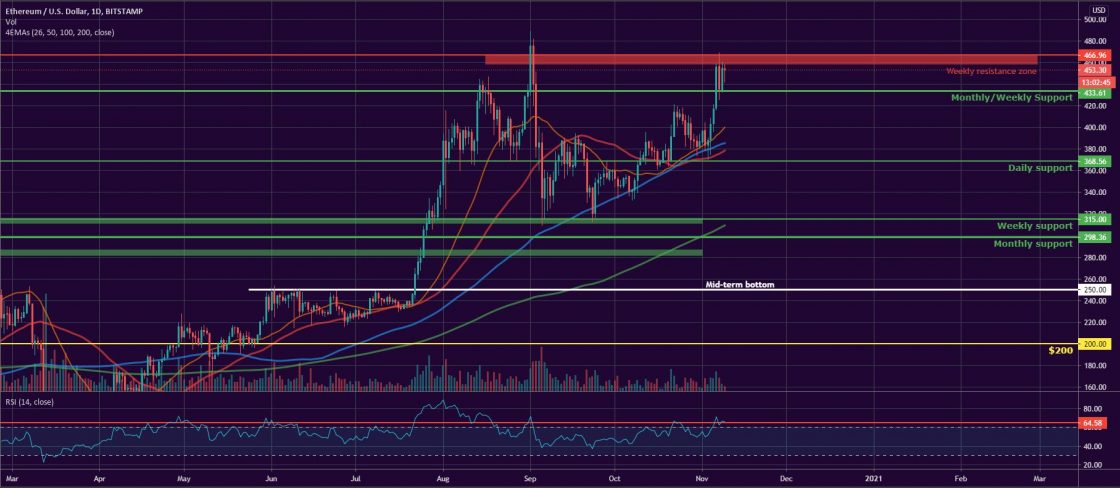
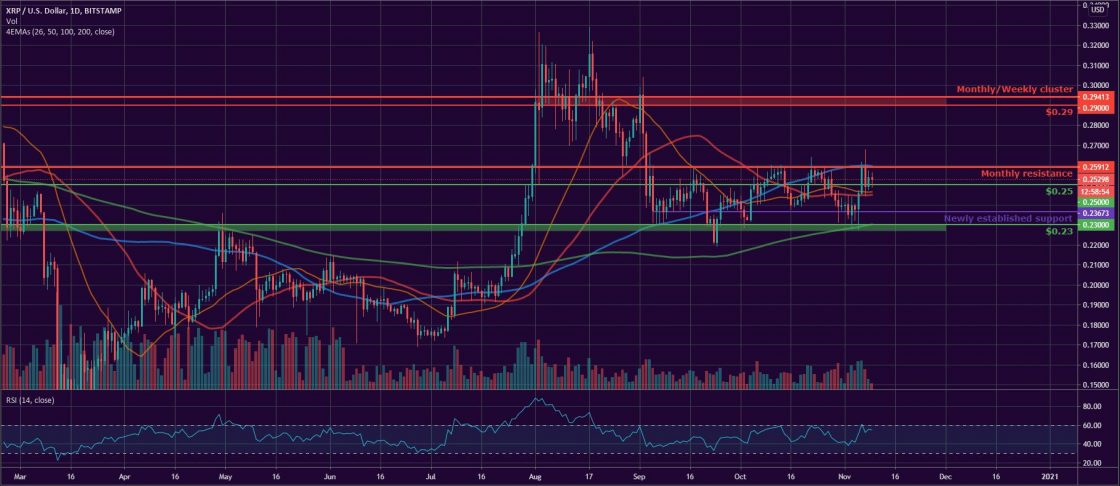
The total crypto market cap added $40.2 billion to its value for the last seven days and now stands at $443.1 billion. The top 10 currencies were mostly in green for the same time period with ether (ETH) and bitcoin (BTC) leading the pack with 14 and 12 percent increase respectively. By the time of writing bitcoin is trading at $15,490, ether climbed up to $453. Ripple (XRP) is hovering at around $0.252.
BTC/USD
Bitcoin closed the month of October with a 28 percent price increase and successfully broke into the $13,700-$13,800 weekly/monthly resistance area on Saturday.
The coin ended the trading session on Sunday, November 1 at $13,730 proving it is still too early for a short to a mid-term trend reversal.
The BTC/USD pair, however, dropped all the way down to $13,250 during intraday on Monday, but found stability at the horizontal support and partially covered in the evening, closing the day with a small loss to $13,555.
The US presidential election day on Tuesday brought some positive vibes to the crypto charts and the leading coin moved up to $14,029, adding 3.3 percent to its value. Bitcoin closed a daily candle above $14k for the first time since January 14, 2018.
BTC continued to surge during the mid-week session on Wednesday and extended its gains up to $14,132 as both crypto and legacy markets were seeing a green wave no matter the uncertainty around the outcome of the US presidential race.
On Thursday, November 5, the BTC/USD pair made its biggest one-day increase for the year and moved all the way up to $15,600. This was a $1,470 jump that corresponded to a 10 percent increase for the coin.
The Friday session was relatively calm as BTC remained flat although it hit $15,960 during intraday.
The weekend of November 7-8 started with a huge drop to $14,844 on Saturday. Then on Sunday BTC compensated for some of the losses and recovered to $15,490.
The 24-hour trading volumes were on the way up since Monday and reached a high of $40 billion on Friday, November 6, then fell down to $29 billion on Saturday and Sunday.
ETH/USD
The Ethereum project token ETH closed the month of October with a 7.2 percent increase. On Sunday, November 1, it climbed above the monthly resistance and closed the day at $396.
The ether fell down to $383 on Monday and erased all gains from the previous session. Still, the coin found stability at the mid-term uptrend line acting as dynamic support for the leading altcoin.
On Tuesday, November 3, the ETH/USD pair was extremely volatile, moving up and down in the $370-$390 zone. Still, bulls were able to form a small green candle to $388 and closed above all major short and long-term EMAs
The Wednesday session was again marked by volatility. The ETH dropped down to $374 in the early hours of trading then jumped all the way up to $409 before closing at $403 or 3.8 percent up.
On Thursday, November 5, the altcoin formed its third consecutive green candle on the daily chart and climbed further to $416.
Bulls were once again on the move on Friday as their preferred coin continued to surge, hitting $456 and thus growing by 9.6 percent.
The trading session on Saturday was not that good for buyers and ETH corrected its price down to $435. It found support at the previous monthly/weekly resistance line.
On Sunday, November 8, the coin erased all losses from the previous session and moved up to $455.
In terms of trading volumes, they started to pick up the pace on Wednesday and literally doubled in the two-day period to Friday, from $8 to $16 billion.
XRP/USD
The Ripple company token XRP closed the trading day on Sunday, November 1 flat at $0.239, but registered a 5.5 loss on a weekly basis. The coin was on its way down ever since it touched $0.263 on October 22.
The XRP/USD pair opened the new trading period on Monday by falling down to $0.235. It erased 1.7 percent and lost the local horizontal support situated near $0.236.
On Tuesday, November 3, bulls and bears were caught in competing in the wide range between the 50-day EMA at $0.244 and the 100-day EMA at $0.227. Still, the former prevailed and helped with the formation of a green candle to $0.239 at the end of the session.
The “ripple” corrected its price down to $0.237 during the mid-week session on Wednesday but still remained above the mentioned support line.
On Thursday, November 5, it fell all the way down to $0.227 in the early hours of trading, but then skyrocketed to $0.245 in the evening, which corresponded to a 2.8 percent increase for the day.
The last day of the workweek came with another solid session for the altcoin. It climbed up to $0.259, hitting the monthly resistance line. The move resulted in yet another 5.7 percent being added to its value.
The first day of the weekend came with a significant drop. The “ripple” experienced a heavy pullback and closed the day at $0.249.
Then on Sunday it rebounded from the $0.25 support and climbed to $0.253.
Altcoin of the Week
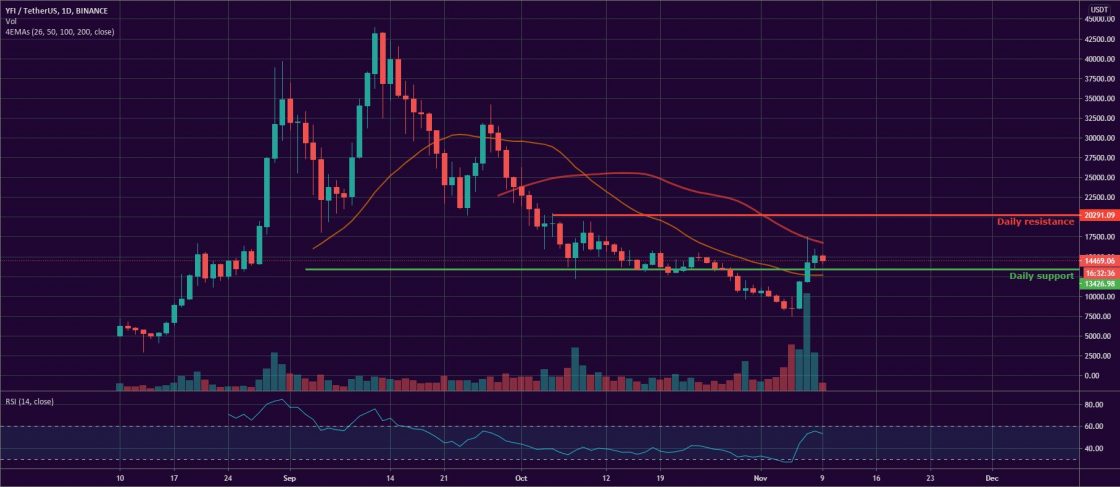
Our Altcoin of the week is yearn.finance (YFI). The well-known yield farming decentralized finance project (DeFI) ended its two-month-long downtrend and rebounded from the $8,450 level on Wednesday, November 5. It increased by 42 percent for the last seven days and reached a weekly high of $16,373 on Saturday, November 7.
The general crypto market uptrend had a big impact on YFI’s price and it climbed up to #43 on CoinGecko’s top 100 list with a total market capitalization of approximately $447 million.
As of the time of writing, the yearn.finance token is trading at $14,470 against USDT on Binance.
Like BTCMANAGER? Send us a tip!
Our Bitcoin Address: 3AbQrAyRsdM5NX5BQh8qWYePEpGjCYLCy4


