The total crypto market cap added $88 billion to its value for the last seven-days and now stands at $1,803 billion. The top 10 coins are mostly in green for the same time period with Ripple’s XRP and Cardano (ADA) leading the pack with 25.3 and 12.6 percent of price increase respectively. Bitcoin (BTC) is currently trading at $57,720, ether (ETH) is at $1,795.
BTC/USD
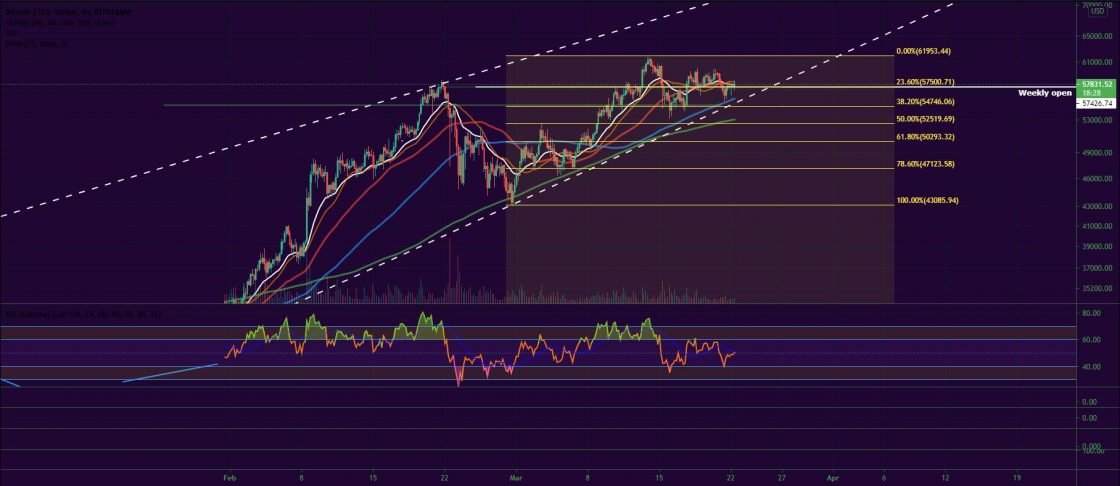
Bitcoin reached a record all-time high on Saturday, March 13. The coin successfully hit the $61,780 mark flying on the wings of the latest US stimulus package agreement. The coin closed the trading week slightly lower, at $58,960, but still added a fresh 15.7 percent to its market cap.
The new seven-day period started with another leg down on Monday. The BTC/USD pair formed a second straight red candle on the daily chart and ended the session at $55,694, temporarily moving below the horizontal support established near $55,000.
The price of bitcoin plunged below the 21-day EMA and almost broke below the lower boundary of the uptrend corridor on Tuesday morning.
Still, buyers were able to take control of the situation and avoided further decline. BTC eventually reversed the direction of the trend and closed in green at $57,000.
The financial world was looking forward to the outcome of the Federal Open Market Committee, but the regulator decided to keep the current policies unchanged, which added some fuel to the cryptocurrency market engine. The mid-week saw the biggest digital asset jumping to $58,820 after trading as low as $54,100 during intraday.
On Thursday, March 18, the BTC/USD pair was relatively stable above the $57,500 horizontal support, but could not succeed in closing above the weekly open line at $58,800, which triggered a selloff at the end of the session.
We witnessed an extremely volatile day on Friday with BTC moving up and down the $56,500 – $59,500 range before closing with a short green candle to $58,130. Traders were caught in a sideways consolidation as the bullish momentum was starting to fade, at least for the short-term.
Buyers made yet another attempt to break above the above-mentioned mark, but the declining volumes prevented them from doing so on Saturday and bitcoin remained almost flat for the day.
On Sunday it continued to be unstable during the intraday trading and ended the week with a short loss to $57,300.
We are seeing no difference in the way BTC behaves in the early hours on Monday, still within the defined range.
ETH/USD
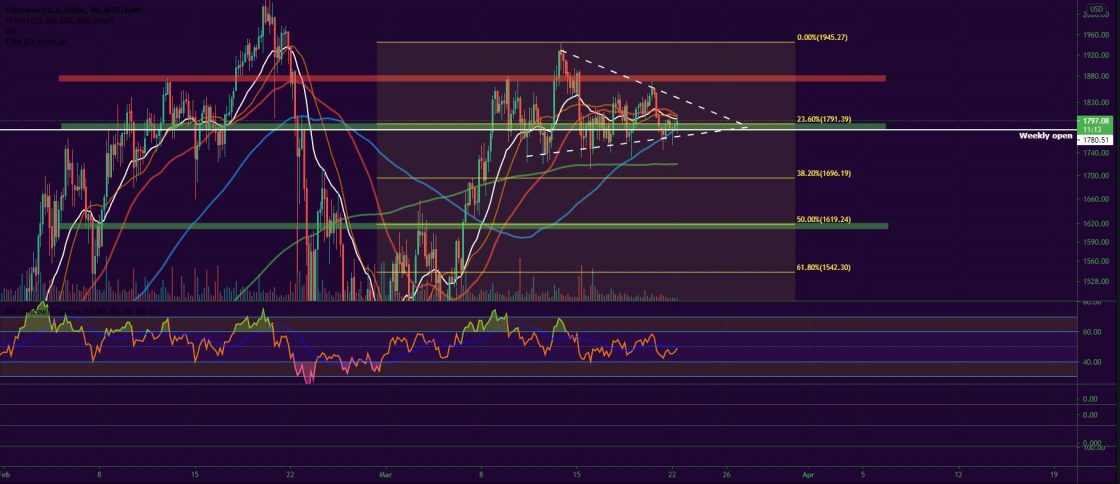
The Ethereum Project token ETH ended the previous week with an 11 percent of price increase. The coin hit the $1,940-$1,960 resistance zone on Saturday, which stopped it from printing a new all-time high and 24 hours later dropped to $1,845 or right below the next major S/R area.
On Monday, March 15, the session was extremely volatile with the price jumping up and down the support zones. It registered a daily low of $1,730, right at the 20-day EMA and although it recovered to $1,730 in the evening part of the session, the correction resulted in a 3 percent loss for ETH.
The bear pressure reached its highest point on Tuesday when the ETH/USD pair broke down to $1,710 losing the short-term EMA and the diagonal support (as part of the uptrend channel). It quickly reclaimed positions above those indicators and even closed the day in green by stabilizing near $1,805.
The mid-week session on Wednesday was an extension of the good performance from the previous day and the ETH/USD pair moved up to $1,822, but not before hitting the weekly open at $1,840.
The coin could not break the resistance formed near the mentioned level on Thursday and dropped down to $1,775 right above the 21-day EMA and the diagonal support.
On Friday, bulls regained some positions above the support zone, but could not erase the losses from the previous day.
The weekend of March 20-21 started with a push to $1,868 in the early hours. The momentum, however, was not sustainable enough and ETH closed in red at $1,804.
The ether is trading in the narrow range between $1,730 and $1,850 since March 11 with the only exception being the short-lived breakout to $1,922 on March 13.
On Sunday, it nosedived to $1,747 in a sudden market crash during the Asia session then went back up to its preferred range around $1,790.
The coin is slowly climbing up to the short-term EMAs on the 4-hour chart on Monday morning.
Top 10 Movers
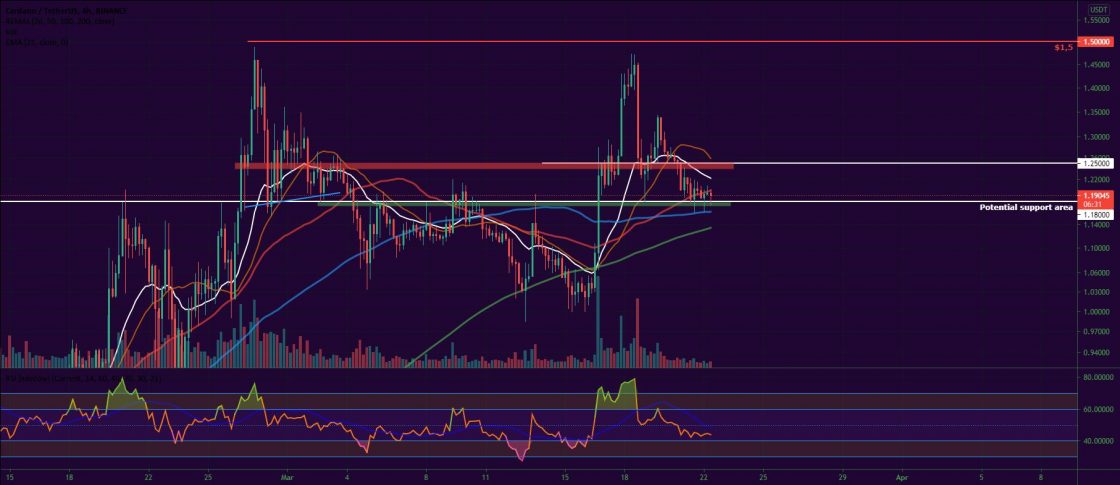
Once again, it was ADA making the news during the past week. The coin, considered by many as the biggest rival to the Ethereum platform, was added to the popular cryptocurrency exchange Coinbase and its Pro version on March 19. The announcement came on March 16 and the ADA/USDT pair rallied to reach $1.45 in the next two days of trading. This resulted in an approximately 40 percent of increase.
The uptrend, however, was short-lived and the coin nosedived to the 100-day EMA at $1.16 on Sunday. What is next for ADA is to recover positions and stabilize above the previously solid horizontal S/R at $1.25.
Down, we see $1.18 as a potential support level on the daily and 4-hour timeframes.
Altcoin of the Week
Our Altcoin of the week is Ecomi (OMI). Another relatively old, but unknown token that benefits from the NFT mania. Ecomi is a digital collectible marketplace project that also runs the VeVe platform for premium format 3D digital collectibles.
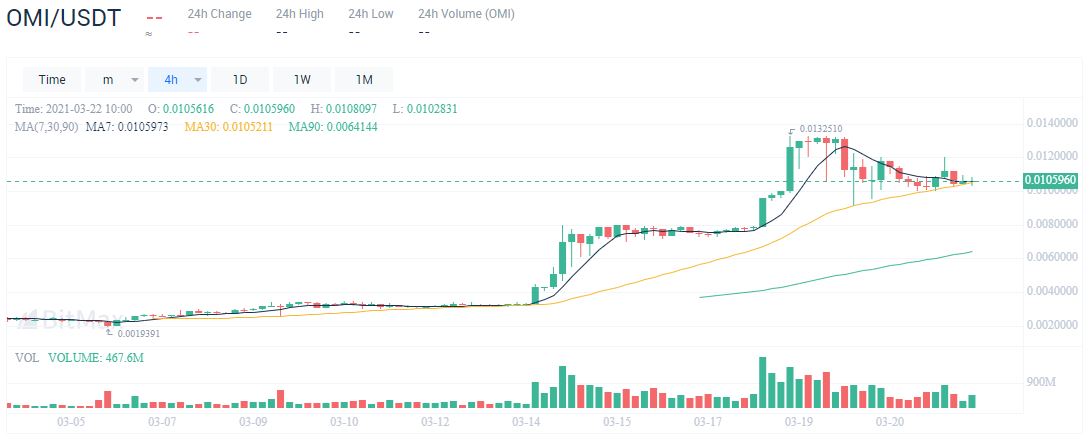
OMI added 59 percent to its value for the last seven days, which made it the 60th most valuable cryptocurrency out there with a market cap of approximately $1.8 billion. It peaked at $0.013 on March 19 and is scheduled for Uniswap listing this coming Wednesday.
As of the time of writing, OMI is trading at $0.0106 against USDT on BitMax:
Like BTCMANAGER? Send us a tip!
Our Bitcoin Address: 3AbQrAyRsdM5NX5BQh8qWYePEpGjCYLCy4


