Bitcoin was trending higher through the early European session on Thursday as a very rare bull signal flashed for the first time in 10 months.
Dubbed as Ichimoku Cloud, the technical indicator turned green to identify a long-term upside trend shortly after bitcoin surged towards $9,769.70 on Wednesday. It also hinted at the imminent formation of a Golden Cross – a popular candlestick pattern that predicts an upcoming bull market.
Gains All the Way
Analysts at trading signals provider TradingShot called out Ichimoku Cloud for its historical accuracy in the past three years. They noted that the indicator correctly determined trend directions. On October 11, 2019, for instance, the Ichimoku Cloud turned red that soon followed the formation of a Death Cross – the opposite of Golden Cross.
Bitcoin fell by circa 25 percent shortly after the bearish signal.
Similarly, when the Ichimoku Cloud rolled over to green on April 20, 2019, bitcoin soon established a Golden Cross on its daily charts. The cryptocurrency later swelled by circa 170 percent to mark its year-to-date high towards $13,868.44. TradingShot explained:
“As you can see on the chart, after every bearish Ichimoku roll-over, a Death Cross follows shortly after. Respectively after every bullish Ichimoku roll-over, a Golden Cross follows. Since the new Ichimoku Bullish roll-over just took place, a new Golden Cross in pending (see on the chart how the MA50 and MA200 have already started to converge).”
The prediction came in tandem with similar bullish expectations all across the bitcoin market. Experts, including billionaire investor Michael Novogratz, the CEO of Galaxy Investment Partners, said the cryptocurrency is eyeing a bull run towards or above $10,000 in the coming sessions.
TradingView.com’s top analyst Jacob Canfield also noted that bitcoin is trending upwards in an Ascending Channel – and there seem to be no breakdowns in views as of late.
Zoom out and keep it simple.
The $9100 flip was a big deal for #bitcoin. Former support of the ‘descending triangle’ and the China pump.
Ascending triangle forming on RSI with a clear uptrend channel on the daily. pic.twitter.com/h2ZTXdT8uR
— Jacob Canfield (@JacobCanfield) February 5, 2020
Bitcoin 1-D Chart
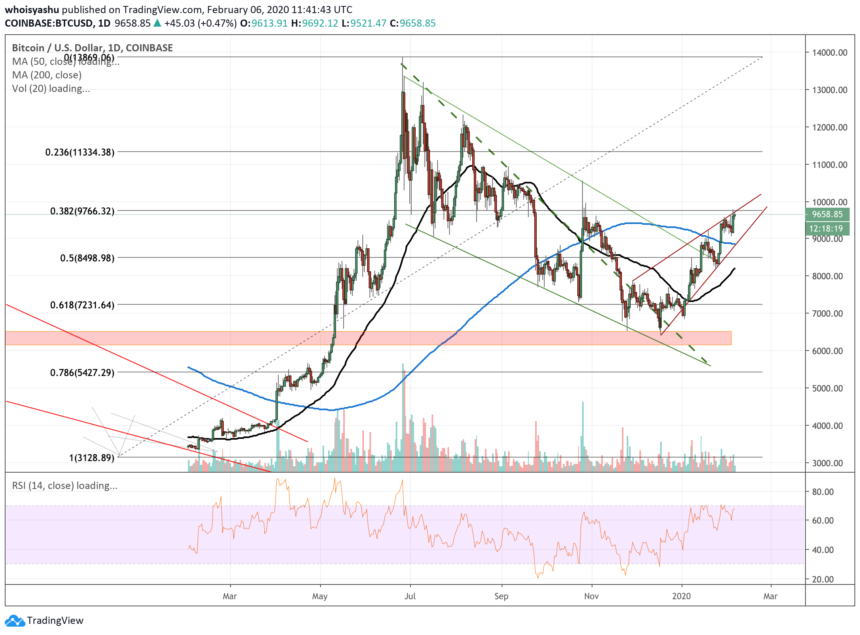
Bitcoin was looking modest during the Thursday’s trading session, trading above $9,650 while holding a major portion of the gains it registered yesterday.
But the cryptocurrency remained locked inside a bearish continuation range defined by the redded Rising Wedge. The channel’s resistance clearly capped bitcoin’s upside attempts that raised the possibility of a deep pullback towards the support (or towards the blued 200-DMA wave).
Moving forward, a bull run continuation could see bitcoin invalidate the Rising Wedge pattern altogether. That would also lead the cryptocurrency towards $10,000 – a psychological resistance.
Conversely, a pullback would strengthen the possibility of a breakdown below the Rising Wedge formation, with a downside target towards the blacked 50-DMA wave.


