Bitcoin has surged massively higher over the past 10 days since bottoming on the OKEx news. The price of the leading cryptocurrency currently is $13,050, far above the lows of $11,200 that were triggered on the OKEx news.
Despite the coin holding $13,000, analysts fear that a strong retracement is in the works. A number of analysts have noted that a number of indicators suggest BTC is overbought on a near term time frame.
Related Reading: Here’s Why Ethereum’s DeFi Market May Be Near A Bottom
Bitcoin Forms Pivotal Sell Signal
Bitcoin is forming a pivotal sell signal that has marked the highs of BTC rallies on multiple occasions.
One crypto-asset analyst shared the chart below, noting that the two-day Tom Demark Sequential has printed a “sell 9” candle. Such candles were seen in the summer, once before the July consolidation, in February, on the days of the highs in 2019. This, coupled with the Stochastic RSI reaching an overbought region, suggests a correction is imminent.
Chart of BTC's price action since the start of 2019 with an analysis of the stochastic RSI and the Tom Demark Sequential from crypto trader CryptoISO.
Source: BTCUSD from TradingView.com
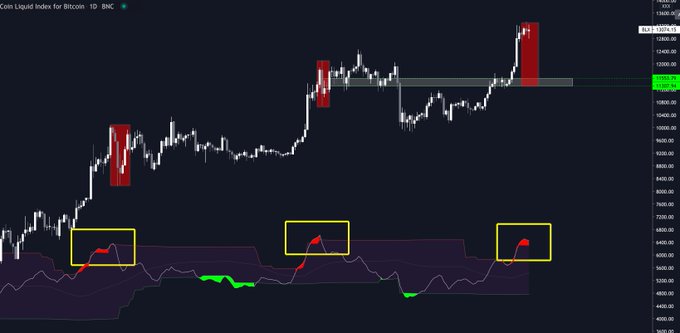
The expectations of a correction have been echoed by analyst Cole Garner. His custom indicator shows that the cryptocurrency is also likely overbought in the near term, and thus will face a short-term correction in the days ahead.
Chart of BTC's price action over the past few months with an analysis of a custom indicator and its effect on price action. Chart from Cole Garner.
Source: BTCUSD from TradingView.com
Related Reading: Tyler Winklevoss: A “Tsunami” of Capital Is Coming For Bitcoin
JPMorgan Also Bearish in the Near Term
JPMorgan analysts are also bearish on Bitcoin in the near term.
The Wall Street giant recently released a three-page report on the crypto market in its regular global macro strategy research note.
The analysts at the firm noted that Bitcoin is currently overbought as per the CME futures positioning indicator, which tracks the derivatives market to see the positioning of traders. The indicator is purportedly at a new year-to-date high, suggesting that Bitcoin will undergo a retracement in the days and weeks ahead.
JPMorgan analysts noted that the last time the indicator was remotely this high was in the summer, prior to the ~25% drop that took the coin to $9,800 from $12,500.
The firm also noted last week that BTC may be intrinsically overvalued. They argued that Bitcoin’s intrinsic valuation may be derived from the mining cost of production.
Related Reading: 3 Bitcoin On-Chain Trends Show a Macro Bull Market Is Brewing
Featured Image from Shutterstock
Price tags: xbtusd, btcusd, btcusdt
Charts from TradingView.com
Bitcoin Forms Sell Signal Last Seen Near 2019 Highs of $14,000


