The sudden $1,500 drop in Bitcoin (BTC) price on August 2 caused over $1 billion worth of liquidations on futures contracts and also led to a sharp decline in the price of many top altcoins.
This massive figure represents 18% of the total $5.6 billion open interest and undoubtedly caused the exaggerated move down to $10,560.
Interestingly, futures open interest recovered half of this loss in less than 48 hours, and currently sits at $5.2 billion. Meanwhile, derivatives indicators like contango (basis), funding rate, options 25% delta skew, and the put/call ratio are mostly unscathed.
Despite such a hefty price move, investors’ positive expectations regarding Bitcoin price remain unfazed as there isn’t a single indicator signaling excessive optimism or bearishness.
This is strikingly different from May 10 when a massive $1,400 drop flipped the majority of indicators to bearish levels. That was the last time liquidations exceeded $1 billion.
Open interest barely registered a blip
Bitcoin futures aggregate open interest. Source: Skew
Take notice how the recent open interest V-shaped recovery differs from the one in mid-May. Back then, futures open interest suffered a $1.2 billion loss, and it took 22 days to recover the $3.6 billion mark.
Contango held steady
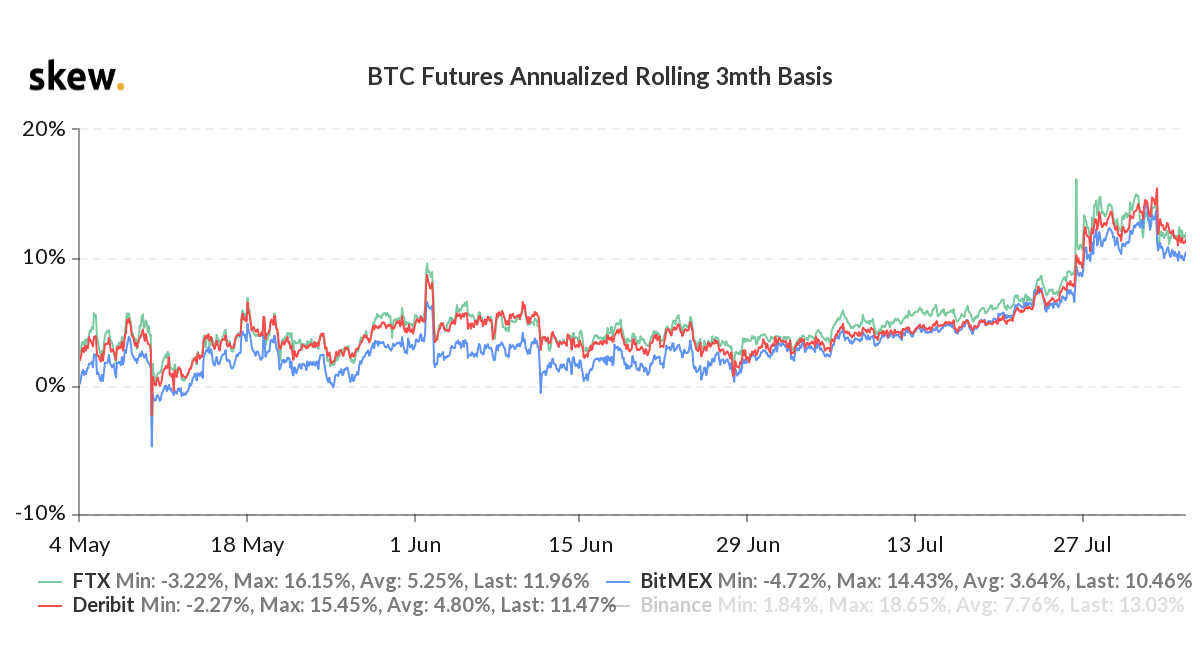
By measuring the 3-month futures contracts premium to current spot levels, one can infer whether professional traders are leaning bullish or bearish. A healthy market should display a slightly positive annualized rate, a situation known as contango.
Bitcoin 3-month futures annualized premium. Source: Skew
The premium toned down a bit after a couple of days flirting with a 15% annualized basis rate, which is rather high when compared to the 1-year average of 6.5%.
It now stands at a healthy 11.5% level, indicating positive expectations as professional traders are demanding more money to postpone financial settlement.
By contrast, the 3-month annualized futures basis flirted with the negative side in May, and took over a month to regain a healthy 5% level.
Perpetual contracts funding returns to normal
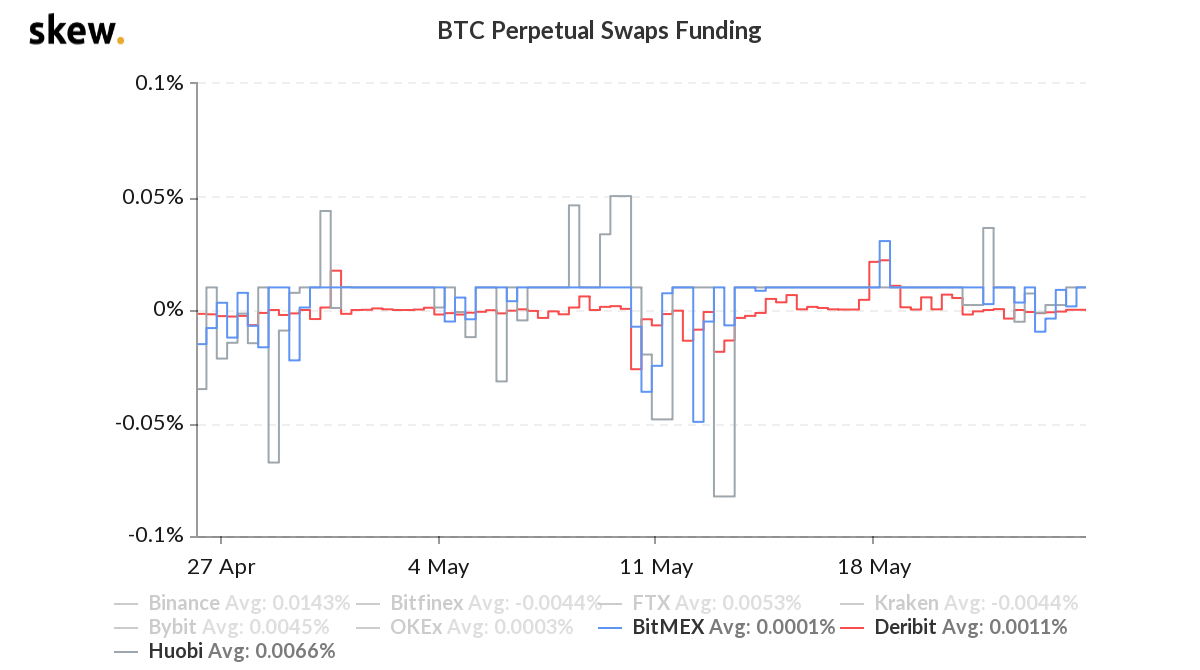
Perpetual futures, also known as inverse swaps, usually have funding rates collected every 8 hours. A positive rate indicates that longs are using more leverage than shorts, so that they will be paying such a fee.
Bitcoin perpetual contract funding rate. Source: Skew
Rates above 0.10% per 8 hours are unusual, although not alarming. This is equivalent to 2.1% per week and would only pressure buyers to reduce leverage when sustaining such levels for several days.
The funding rate has receded to a very healthy level, indicating no sign of bearishness or excessive buyers’ leverage. The current situation bears zero resemblance to the May 10 crash, when the funding rate was negative, meaning sellers were paying to keep open positions.
Bitcoin perpetual contract funding rate. Source: Skew
The above chart shows the funding rate reaching the -0.13% level back in May, while positive funding would only occur three weeks later.
Options markets 25% delta skew remains bullish
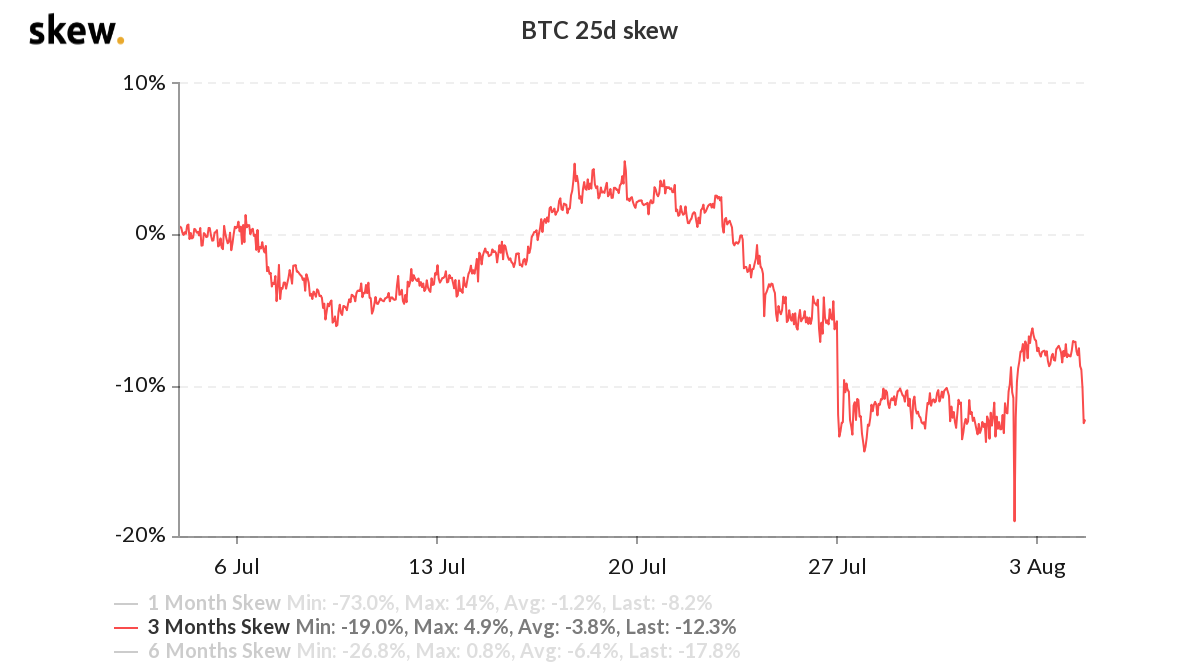
The 25% delta skew measures how the more expensive market is pricing bullish call options compared to equivalent bearish put options.
Bitcoin 3-month options 25% delta skew. Source: Skew
The 25% delta skew acts as an options traders’ fear/greed indicator and it is currently sitting at a negative 12%, meaning protection to the upside is costlier. This is another positive indicator as it usually oscillates between -15% to +15%.
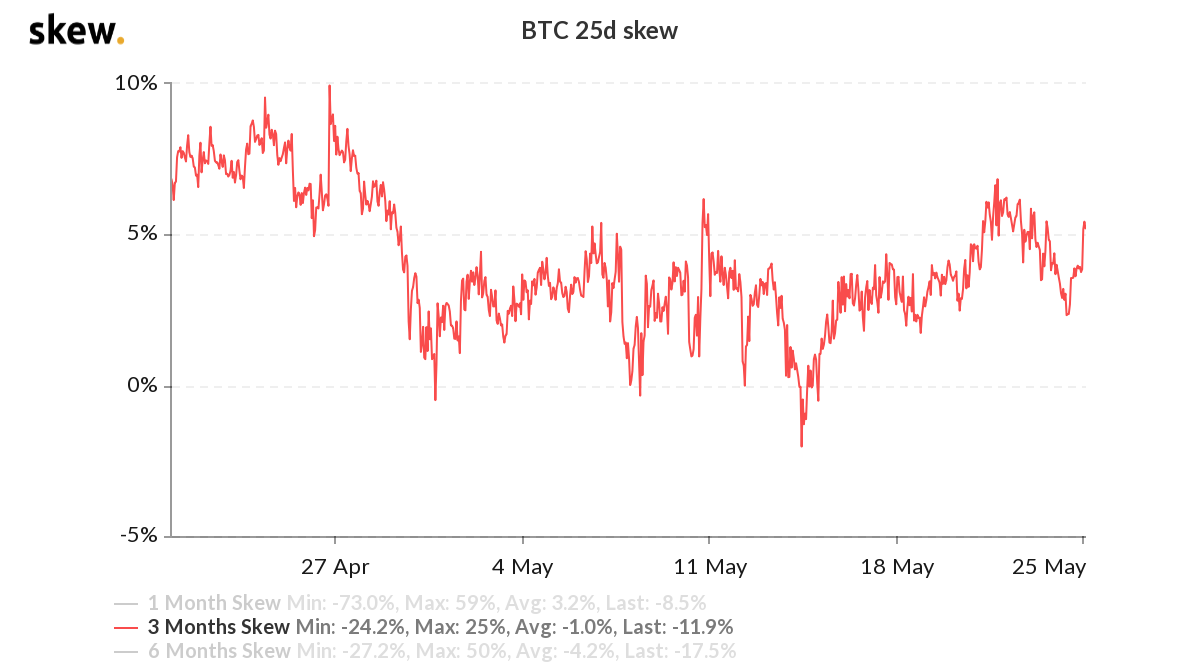
Bitcoin 3-month options 25% delta skew. Source: Skew
Such an indicator remained close to 4% after the May 10 crash, indicating a slightly bearish trend. Premium for downside protection options (puts) was higher than bullish calls.
Options put/call ratio remains bullish
The options put-call ratio measures the calls total open interest against puts. Generally speaking, call options are used for bullish strategies, whereas put options for bearish ones.
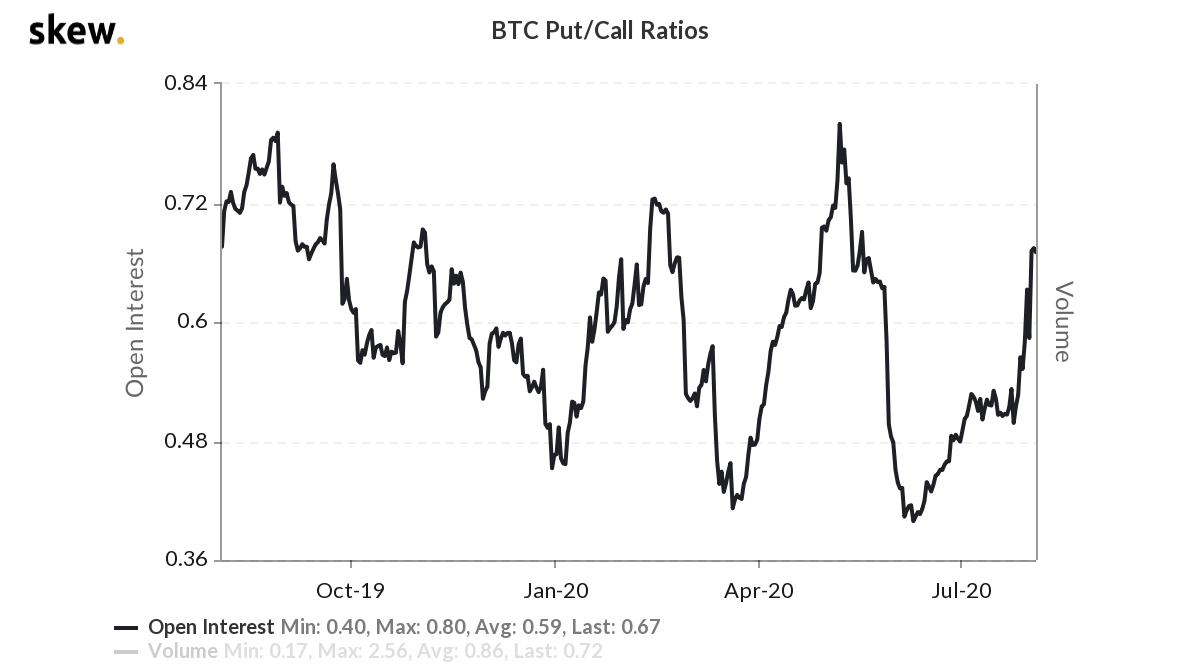
Bitcoin options put/call ratio. Source: Skew
The current put/call ratio of 67% means that put options (bearish) open interest is 33% smaller than call options (bullish). The 1-year average stands at 59%, indicating that options traders are generally spending more money on call options, expecting price increases.
On the other hand, the put/call indicator peaked at 80% just three days ahead of May 10. Despite remaining in the bullish territory, that was the smallest difference between put and call options open interest in 10 months.
Most indicators favor bulls at the moment
There is no sign that recent Sunday’s $1,500 price crash somehow diminished professional investors positive expectations. There is undeniable data from derivatives markets differentiating from the May 10 crash, when Bitcoin took 24 days to set a new high.
Professional traders have been leaning bullish since July 24, and there is no sign that such a significant price drop has shaken buyers.
Overall it does not seem a good time to go against the majority, creating a perfect scenario for altcoins to make new highs.
The views and opinions expressed here are solely those of the author and do not necessarily reflect the views of Cointelegraph. Every investment and trading move involves risk. You should conduct your own research when making a decision.


