View
- Bitcoin tends to pick up a strong bid six months ahead of the reward halving, according to historical data.
- With the halving event due in May 2020, BTC may rise above the recent high of $10,350 in November and could challenge the 2019 high of $13,880 over the next couple of months.
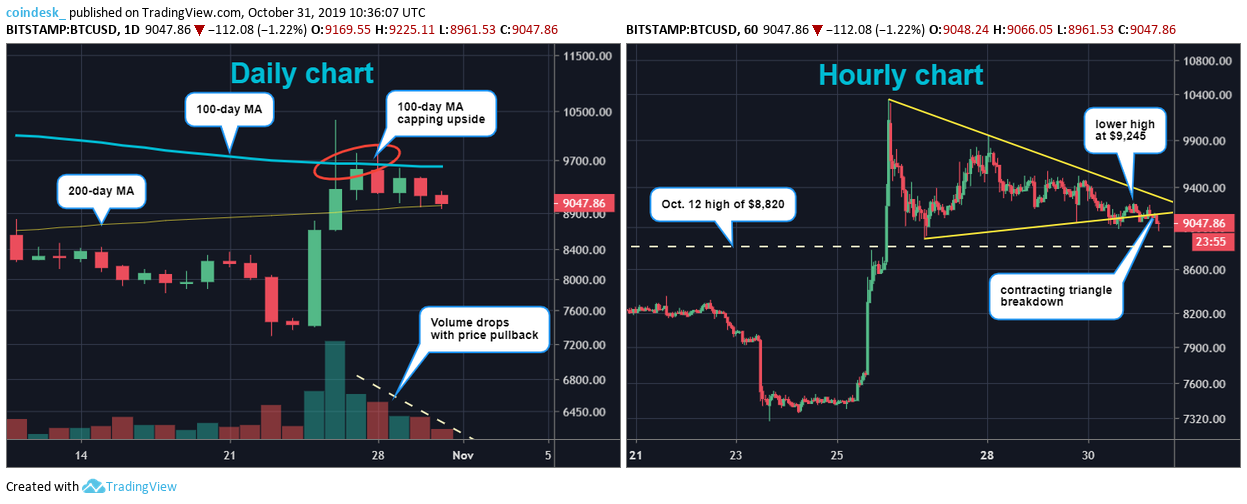
- Shorter term, a contracting triangle breakdown on the hourly chart suggests scope for a drop to $8,820 in the next 24 hours. The bear case would be invalidated if prices rise above the hourly chart resistance of $9,245.
- A quick move above $9,245 and a rally to the 100-day average at $9,606 shouldn’t be ruled out, as the recent pullback from $10,350 lacks volume support.
Bitcoin will likely put on a good show in November with a price-positive event due in six months.
The number one cryptocurrency by market value is leaving October on a positive note, having recovered sharply from five-month lows below $7,500 seen a week ago.
The rally could be extended further next month, as the cryptocurrency is set to undergo a mining reward halving in May 2020. The process is aimed at curbing inflation by reducing the bitcoin reward per block mined on the blockchain by 50 percent every four years.
Currently, miners get 12.5 BTC for every block mined. That will drop to 6.25 BTC after the halving, meaning 50 percent fewer bitcoins will be generated every 10 minutes. To put it another way, the supply of new coins will drop by half after May.
In the past, the cryptocurrency has picked up a strong bid six months ahead of the reward halving.
Bitcoin’s block reward was cut from 50 BTC to 25 BTC in November 2012. BTC rallied from $5 to $16 in the three months to mid-August and built a new base around $10.00 in November.
On similar lines, BTC jumped from $360 to $780 in the four months to mid-June 2016, before trimming gains and falling back to $465 in August, when the block reward was cut from 25 BTC to 12.5 BTC.
The data indicates the market begins pricing in an impending supply cut six months in advance.
So, if history is a guide, BTC may rise well above the recent high of $10,350 in November and could challenge the 2019 high of $13,880 over the next couple of months.
Positive Seasonality
Adding to the likelihood of a rally, bitcoin has scored gains in November in six out of the last eight years.
Notably, November was a green month for six straight years from 2012 to 2017. The winning run ended last year with a 37 percent drop – the biggest November loss on record. Back then, however, BTC was in a bear market. The cryptocurrency had already dropped 70 percent from the record high of $20,000 reached in December 2017.
This time, the overall trend is bullish, as indicated by the triple-digit year-to-date gains. BTC, therefore, is likely to revive the November winning tend.
Currently, bitcoin is changing hands around $9,100 on Bitstamp, representing a 0.2 percent drop on a 24-hour basis. The cryptocurrency is trapped between key moving averages (MAs), as seen in the chart below.
Daily and hourly charts
Bitcoin has come under pressure in the last 24 hours, as expected, but the downside is being restricted around the 200-day MA, currently at $9,025.
The contracting triangle breakdown seen on the hourly chart indicates that bitcoin could drop further to the former resistance-turned-support of $8,820. A violation there would expose next support lined up at $8,474.
The outlook, as per the hourly chart, would turn bullish above the lower high of $9,245. A quick move above $9,245 cannot be ruled out as the recent pullback from $10,350 is accompanied by a drop in trading volumes. A low-volume correction is often short-lived.
A break above $9,245 would likely yield a retest of the 100-day MA at $9,606. Note that BTC has failed three times in the last five days to hold on to gains above the long-term average. As a result, a UTC close above the 100-day MA could embolden bulls, leading to a sustained move above $10,000.
Disclosure: The author holds no cryptocurrency assets at the time of writing.
Bitcoin image via Shutterstock; charts by Trading View


