Photo: Steven Millstein / Flickr
Key Highlights:
- The breakup of $4,237 resistance level will increase Bitcoin price towards $4,692;
- in case the bulls do not defend the support level of $3,679, BTC will find its low at $3,257;
- the break out is imminent.
BTC/USD Long-term Trend: Ranging
Resistance levels: $4,237, $4,692, $5,209
Support levels: $3,679, $3,241, $2,765
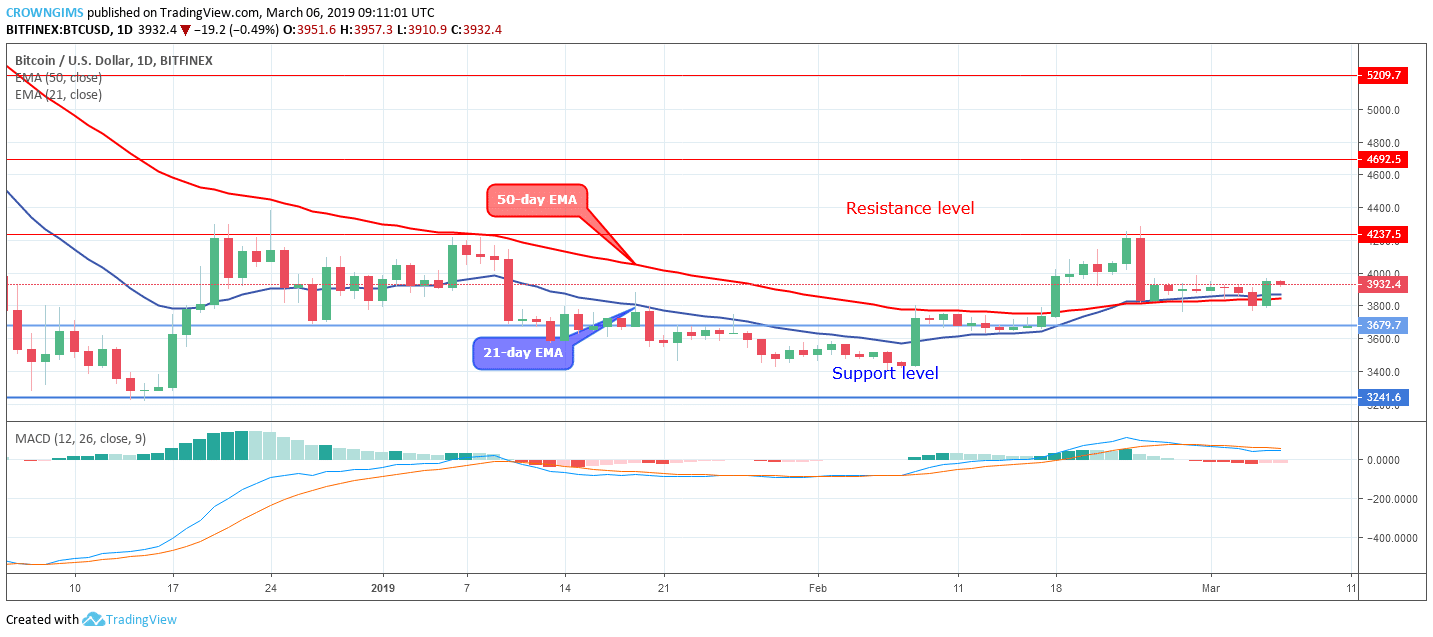
On the long-term outlook, BTC/USD is ranging. The momentum of the Bears and that of the bulls remain at an equilibrium level and that is what brought about this consolidation scenario. Not until the Bulls or Bears gain enough pressure that will make the coin rally to the north or to the south respectively, the ranging movement in the BTC market will continue.
An attempt made yesterday by the bulls to breakout with the formation of daily bullish candle failed and could not make headway. Today, another daily bearish candle is emerging on the two EMAs.
The two EMAs are tightly fixed, horizontally flat without direction. Bitcoin price is hovering around and over 21-day EMA and the 50-day EMA which indicates that the consolidation phase is not over.
The Moving Average Convergence Divergence period 12 with his histogram remain flat on the zero levels and likewise the signal line, this confirms that ranging movement in the BTC market may continue.
The bulls have to double their momentum before the BTC price can breakout at $4,237 resistance level which will expose the resistance level of $4,692.
BTCUSD Medium-term Trend: Ranging
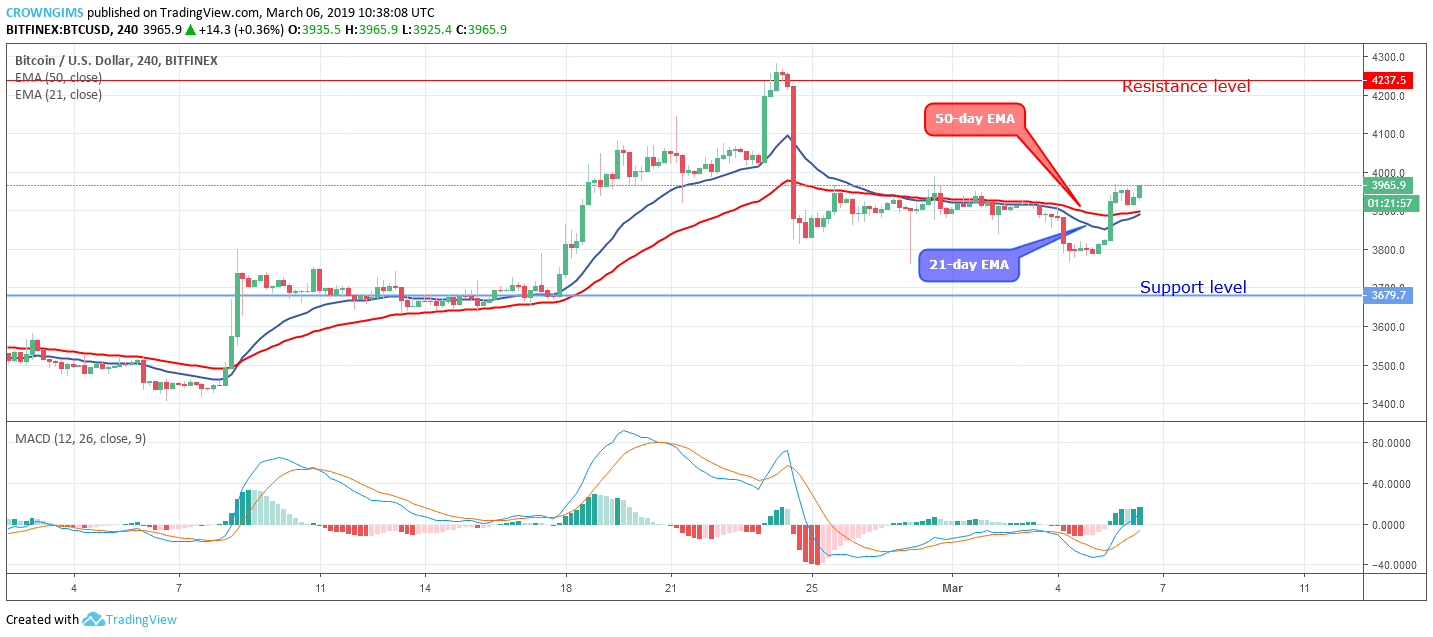
The Cryptocurrency remains on the ranging movement on the medium-term outlook. Bitcoin price continues trading within the range of $4,237 resistance and $3, 679 support levels. As at now, the Bulls are making effort to pull out the coin from the consolidation face but the bears are also opposing the movement.
The bulls or the Bears have to prevail before the coin can rally. In case the Bears prevail, Bitcoin price will decline towards $3,679 support level and may have $3,271 as its target.
The BTC price is currently consolidating above the two EMAs with the 50-day EMA above the 21-day EMA close to each other. The MACD period 12 with its histogram is above zero levels and the signal lines pointing up to indicate buy signal.


I am a cancer survivor and with his promise to repeal the Affordable Care
Act I will not be able to get health insurance.
Canada doesn’t have Trump or Clinton. Truthfully neither one of those would have been good choices.
They should have chosen Bernie Sanders. He actually had a real chance at beating
Trump.