Photo: QuoteInspector
Key Highlights:
- There was a bullish break out;
- bears lost control over Bitcoin market;
- the bulls were in charge of the BTC market.
BTC/USD Long-term Trend: Bullish
Resistance levels: $4,716 $5,447, $6,281
Support levels: $4,224, $3,649, $3,209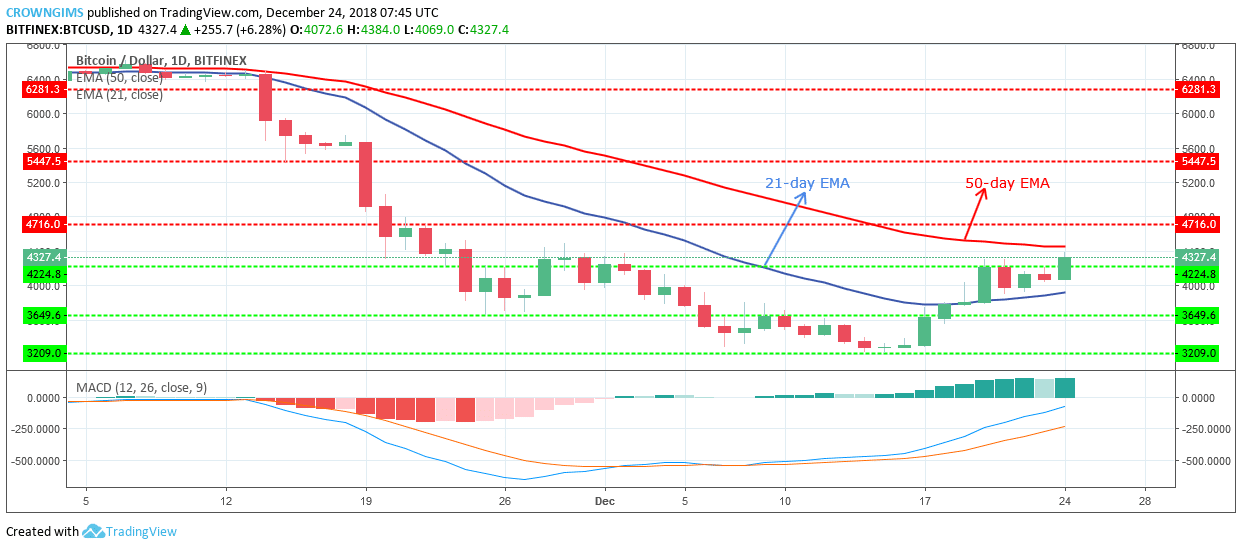
The coin is trading in-between 21-day EMA and 50-day EMA as at the time of writing while 50-day EMA is above the coin. The MACD period 12 with its histogram is above the zero levels and its signal lines point up, which connote that the uptrend is ongoing and buy signal, may continue.
Should the bullish pressure break up the 50-day EMA and the resistance level of $4,716, then, it may have its target at $5,447 – $6,281 price level.
BTCUSD Medium-term Trend: Bullish
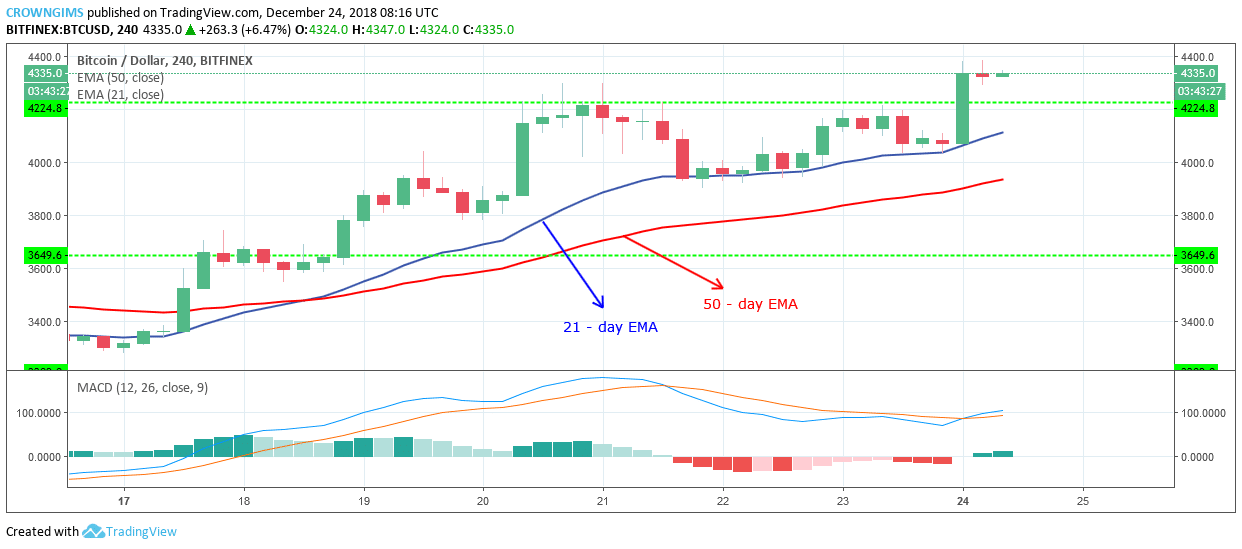
Bitcoin is trading above 21-day EMA and 50-day EMA with the former above the later distance from each other connotes that the bulls were taking over the BTC market. The MACD period 12 with its histogram is above zero levels and the signal lines pointing upside is an indication that the bullish trend may continue for the next few trading sessions. Traders should not forget that pullback is inevitable periodically.