Photo: HitBTC
It’s a brand new week, and even though it’s equally possible that it may bring us both a storm of surprises and a steady performance, we’re ready to face it all. Currently, the market is sitting in a position influenced by bearish sentiments. Armed with the most important metrics, we will elucidate what there is to know of today’s crypto exchange values, trends and milestones.
Market Capitalization
In a general sense, it is a measure of the value of a security. In the context of cryptocurrency, it’s defined as the circulation supply of coins multiplied by the current price.
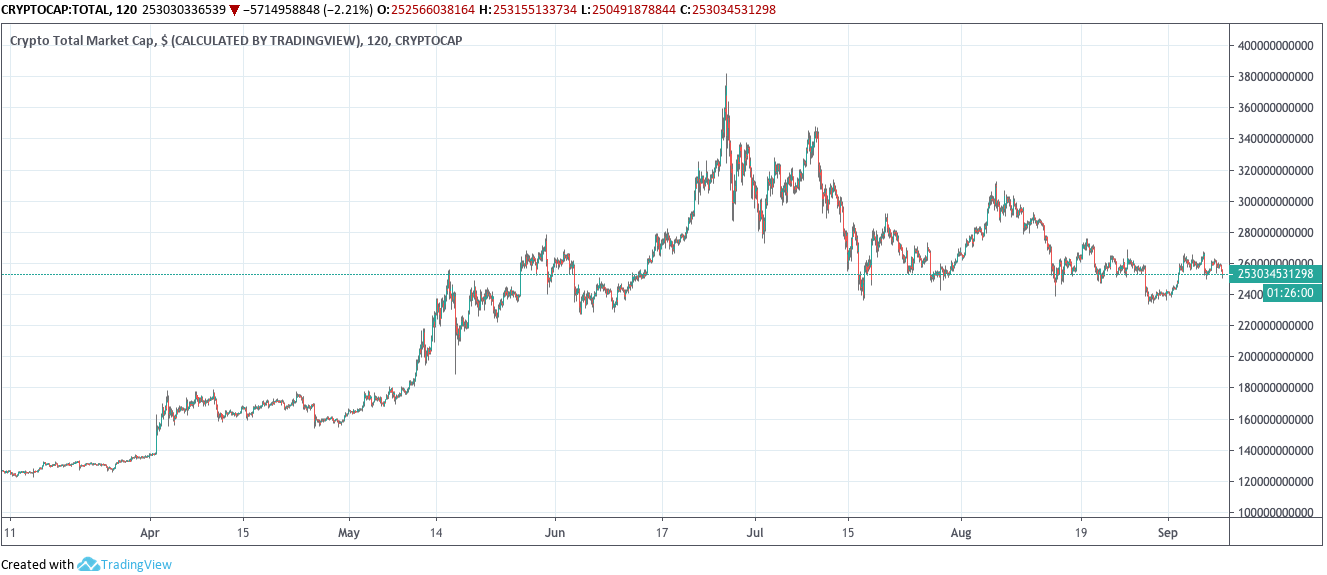
Trading view offers the following chart portraying the change in the past 6 months of Crypto Market Capitalization:
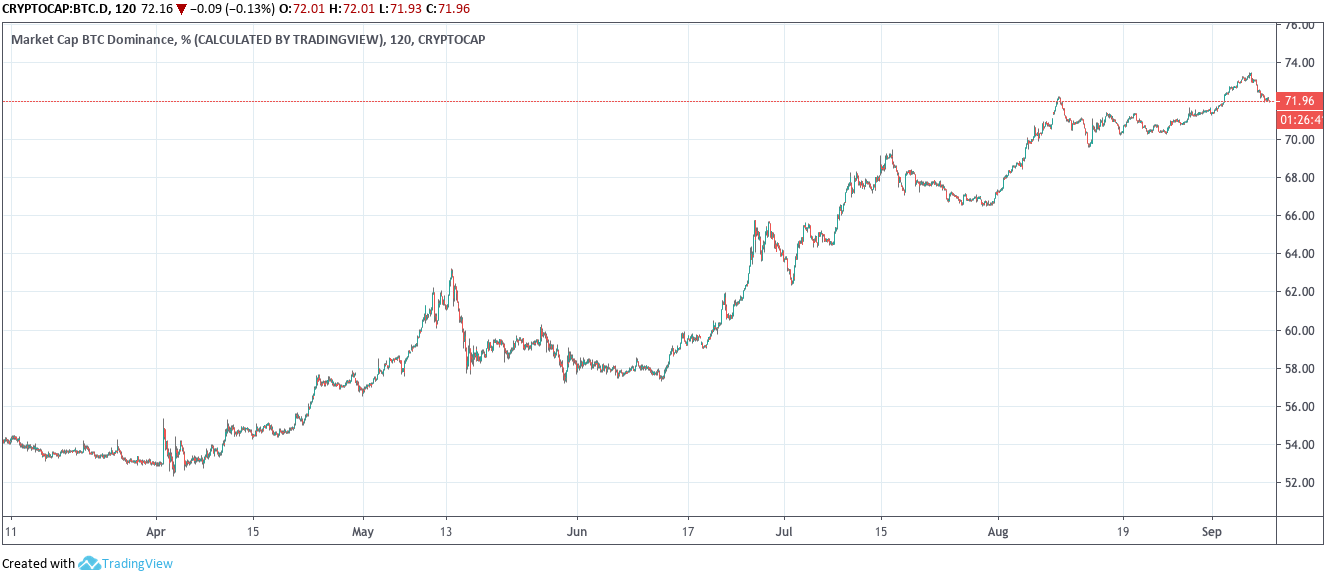
As of today, 9 September 2019, total market cap is at $261,415,553,824. Bitcoin is leading the cryptocurrency market with a dominance rate of 69.8% (around a 1% decline over the weekend), a market cap of $182,403,480,205 and a 24 hr volume of $14,574,589,608.
Daily prices: Bitcoin and Altcoins
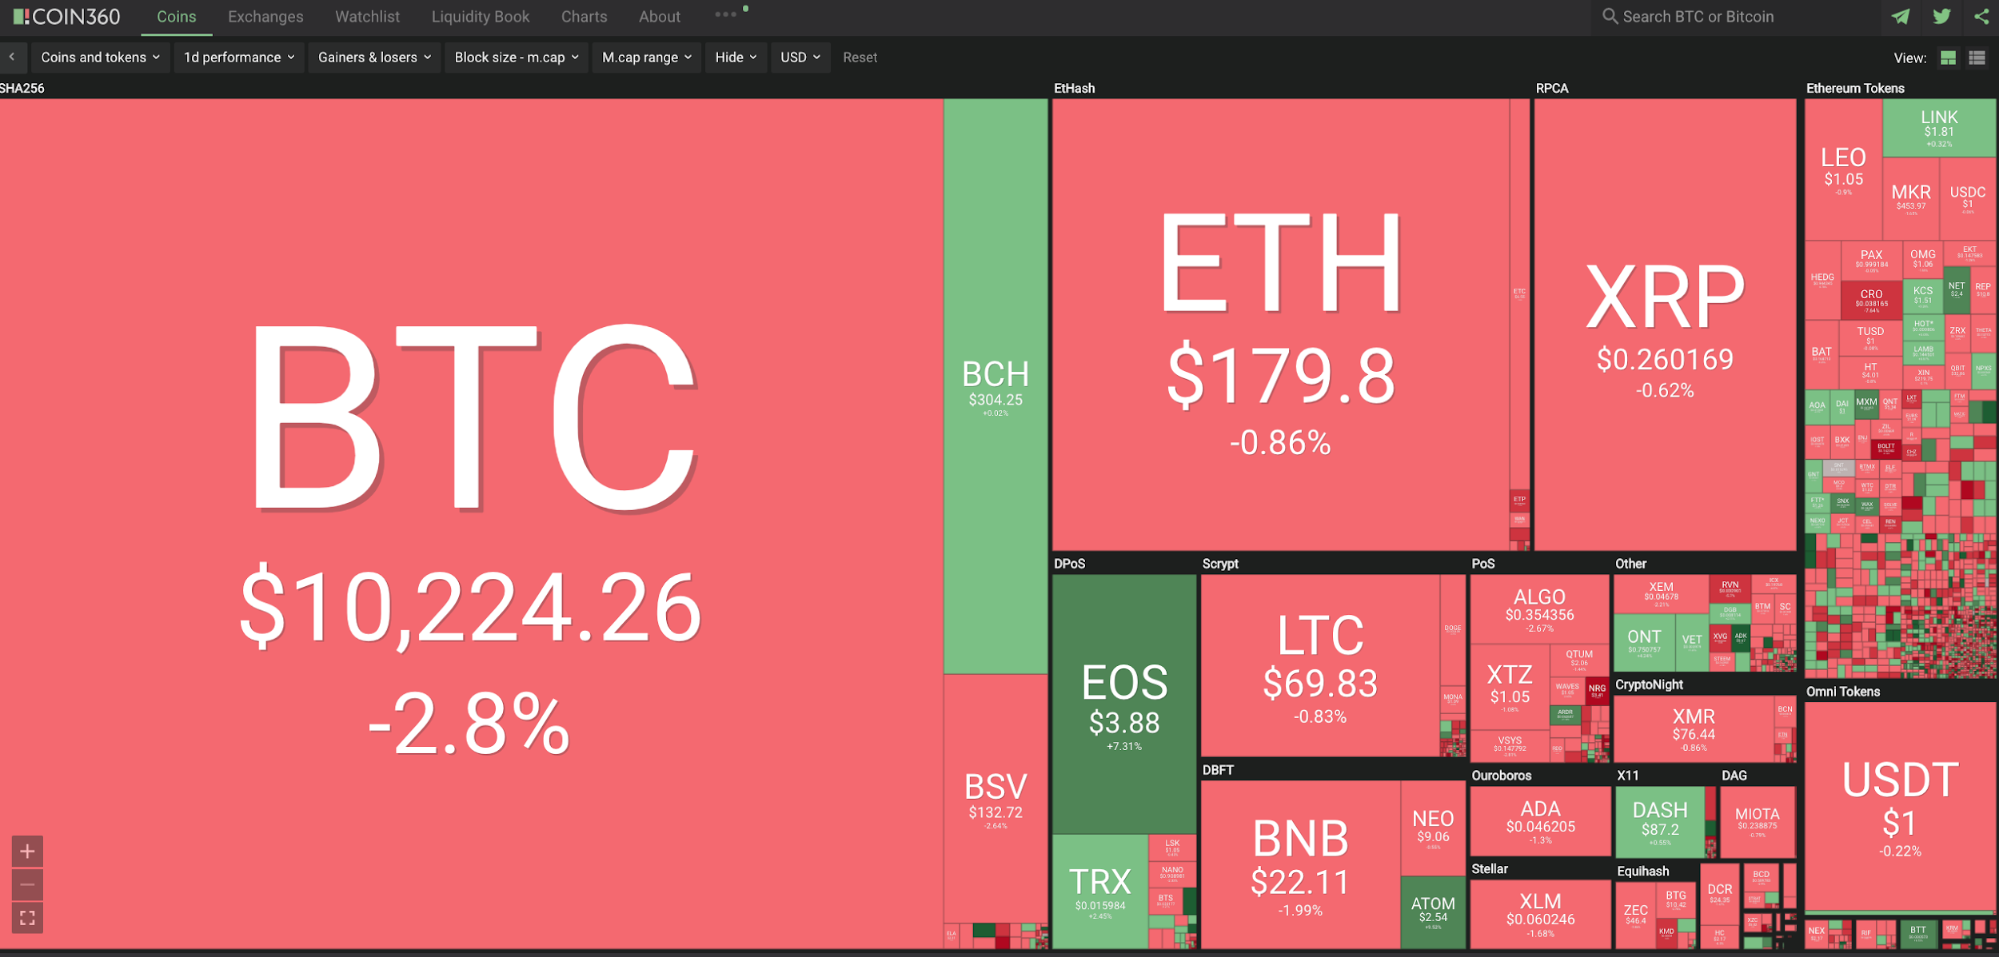
The following price changes are taken from the Coin360 frontpage.
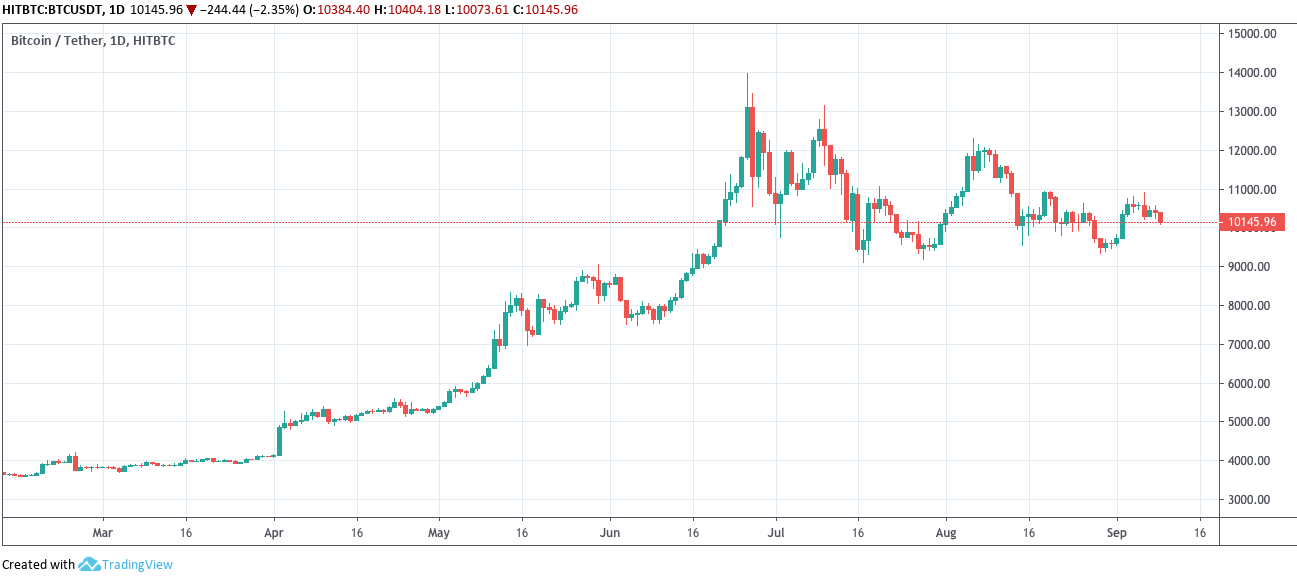
At the time of writing, the price of Bitcoin is $10,224.26, down 2.8% from the day prior. Bitcoin started this week with a sell-off, acting according to the bearish sentiments of the market. However, the long term trend may still look bullish, so it takes time to test deeper waters.
Additionally, Bitcoin has lost some market territory after a promising gain of last week.
As for the current price dynamics of altcoins, the Сoin360 homepage screen shot is a representation of their prolonged trend downwards. Despite the decline in the Bitcoin market dominance, most of the altcoins are registering downward trends. Ethereum (ETH), the largest altcoin by market cap, declined by 0.86%. There have been other significant drops, see Binance Coin (BNB) and Algorand (Algo); while there also have been some upward climbs, see for EOS (EOS).
Liquidity Book
Liquidity defines an asset’s ability to be converted into cash or other coins without causing price disruptions, which is of immense significance in such a volatile industry.
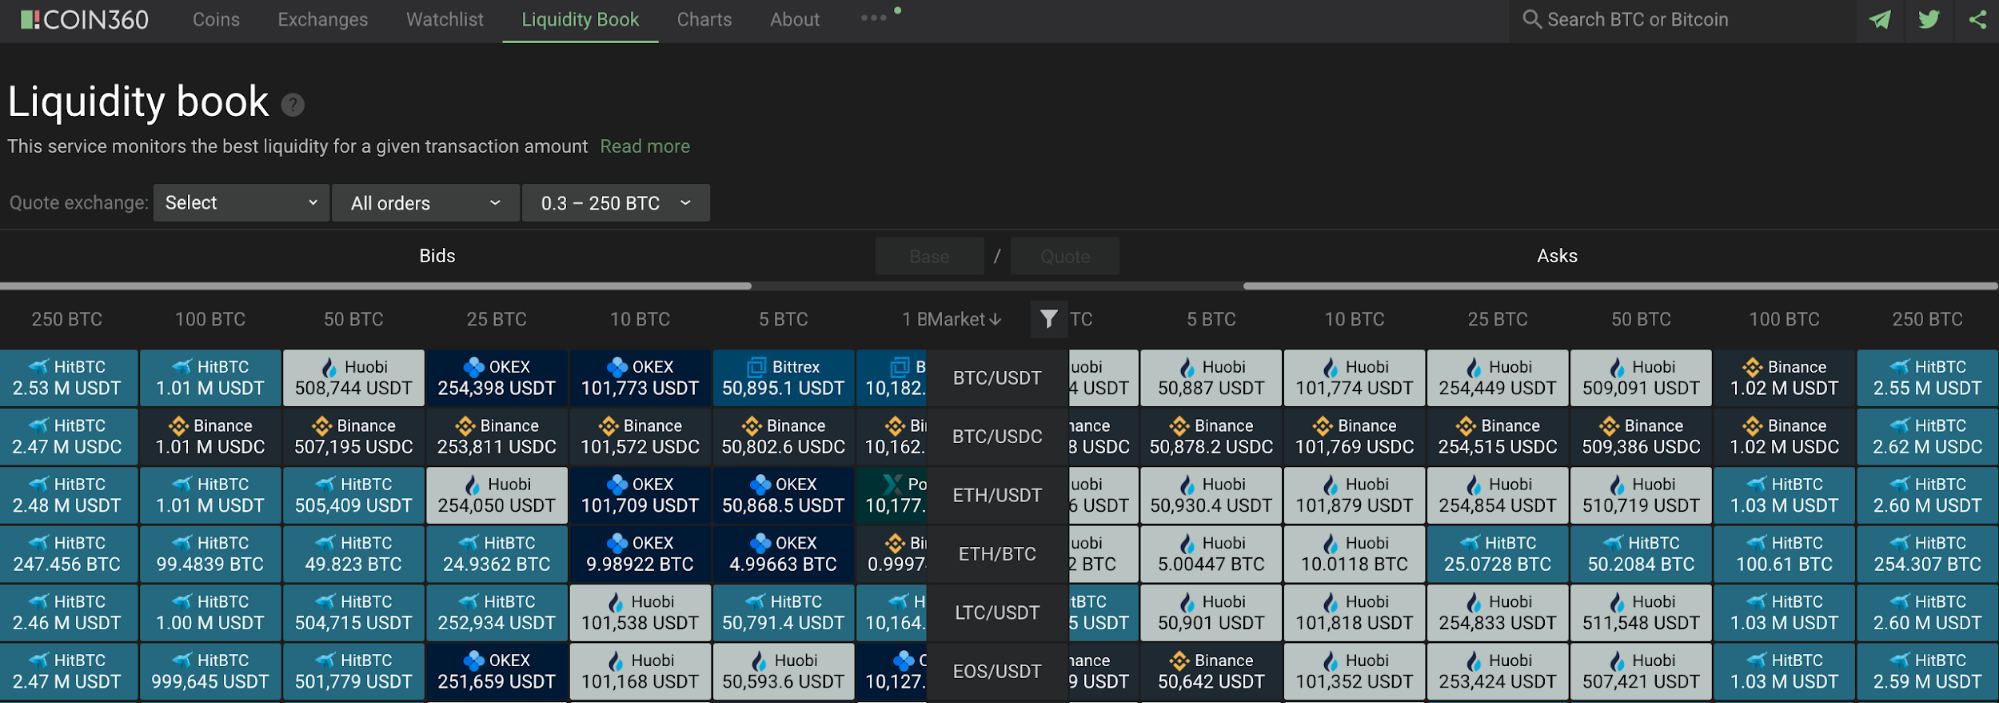
Below is a screenshot of what the Liquidity book looks like at Coin360. Here you’ll see an illustrative layout of the bigger aggregated picture of the market liquidity. The amount for which the calculation is made is indicated in the column headings of the table, and currency pairs are demarked in the Market column. Pairs can be filtered both by currency and by quotation, and filtering occurs on the fly.
As you can see, HitBTC has the best liquidity in the industry among higher trading volume exchanges, providing a narrowing bid ask spread. For the most currency pairs filtered at the volume of, let’s say, 50-250 BTC, market dominance again belongs to HitBTC.
With the cryptomarket, every second is significant. Early runs can turn into disasters and vice versa. Check in with us tomorrow to see what the next day brings.


