Two weeks ago, Bitcoin price set a record for its third-largest 24-hour gain in the young asset’s short history, rocketing from $7,400 to $10,500 from low to high.
After weeks of consolidation, the crypto asset has run out of steam and has begun to fall, first breaking below support at $9,000 where it is currently trading. Can bulls push Bitcoin price back above support and make a push higher, or will bears regain control and potentially set a new local low?
Bitcoin Price Finds Itself In Another Descending Triangle, Breakdown Begins
This morning, after weeks of indecision and ping-ponging between a tightening range, the first-ever crypto-asset finally appears to have made a decision on its direction in the short term and has fallen below support at $9,000.
Related Reading | Bitcoin Momentum Points To Continued Downtrend Short Term, Medium Term Trending Up
Once again, Bitcoin may have found itself trading within a descending triangle pattern – a pattern that has repeatedly spelled disaster for the crypto asset throughout the bear market. The pattern, which makes lower highs but similar lows, on lower timeframes finally gave way, and Bitcoin price has started to fall.
If the pattern is indeed a descending triangle, the resulting breakdown could bring the crypto asset back to local lows, or potentially lower, reaching the bottom of a multi-month channel Bitcoin has been trading within.
Possible Bull Flag Formations Could Save Crypto Bull Market
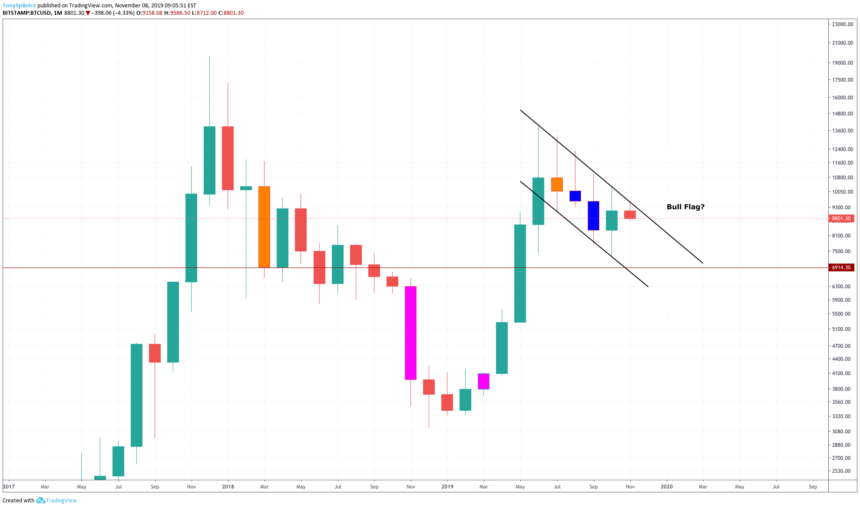
All hope isn’t lost for bulls just yet, even despite today’s drop. The powerful rally also could have been the flag pole in a massive bull flag that is forming. Bull flags typically make lower highs and lower lows, before eventually once again taking bears by surprise with a quick break above resistance.
If Bitcoin price can find support at current levels – roughly $8,800 – it could suggest that the pattern is actually a bull flag and not a descending triangle, with a target of over $11,000.
A move toward $11,000 or above would set a new higher high, and would likely restore the confidence of bullish crypto investors and support the theory that Bitcoin’s next bull run is beginning.
If not, the historic rally may be almost entirely erased, and a deeper drop would be likely. However, it still wouldn’t mean that Bitcoin’s chances for a bull market are completely lost, as even a deeper drop into the current multi-month channel would still be within a larger bull flag formation on monthly Bitcoin price charts.
Related Reading | Bitcoin Monthly Close Keeps Bull Flag Formation Intact, Target Over $14,000
The target of the bull flag on the monthly price chart, would be a new all-time high. Once Bitcoin broke above its former all-time high in 2017, the true bull run really began – ultimately making Bitcoin and crypto household names and taking the asset to its all-time high of $20,000.


