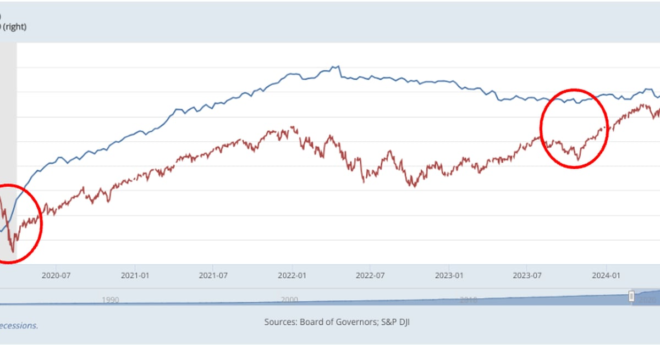
Historically, there has been a strong correlation between the S&P 500 and the M2 money supply, with both moving in tandem over the past five years. For example, during the early 2020 pandemic, M2 bottomed out at $15.2 trillion in February, just before the S&P 500 hit a low of around 2,409 points in March. A similar pattern occurred in October 2023, when monetary policy tightening led M2 to bottom at $21 trillion. Shortly afterward, the S&P 500 reached a low of 4,117. This connection highlights the critical role of liquidity in driving stock market performance.
Bitcoin Price (BTC) and Risk Assets Moving Higher With Money Supply