Bitcoin price is currently flirting with prices above $60,000, as the momentum of the ongoing bull market slowly begins to push the asset above the key resistance level.
The start of a breakout through resistance might have began with last night’s historic weekly close – the highest ever recorded. However, despite what could be a clean bullish breakout, there’s a bearish factor lingering that could make this the last weekly close the high for some time.
Bitcoin Price Closes Record High Weekly Candle Above $60,000
Bitcoin price has poked above $60,000 dozens of times now, yet has been unable to hold strong above the clearly strong resistance level. The leading cryptocurrency by market cap, however, has also yet to tumble any further than a mere 10-20% for most of the last 12 months.
Related Reading | Crypto CEO “Convinced” Of Bitcoin Cycle Top, Warns Of Sell Side Intensity
The first signs that new highs could be near, is the first ever historic weekly candle close above $60,000. Last night’s weekly candle is also only the second daily candle to close above the crucial rounded number.
You have to zoom in to see it, but Bitcoin did close above $60,000 on Binance | Source: BTCUSDT on TradingView.com
The battle between bulls and bears came down to the very last seconds before the close, resulting in some disparity across exchanges. Bitcoin price made the achievement on Binance specifically and others, but failed to make a similar milestone on platforms like Bitfinex and Coinbase.
The slight discount on Coinbase could be a sign that buy pressure is finally waning and the sell side is intensifying.
Why The Record Could Precede A Short-Term Reversal
The cryptocurrency market has been on fire and its been mostly due to the rush to buy Bitcoin before other corporations and hedge funds buy it all.
But as mentioned, the FOMO could finally be running out of steam. Making matters worse, an ultra rare signal has appeared that has only in the past reared its head when the crypto cycle was finally complete.
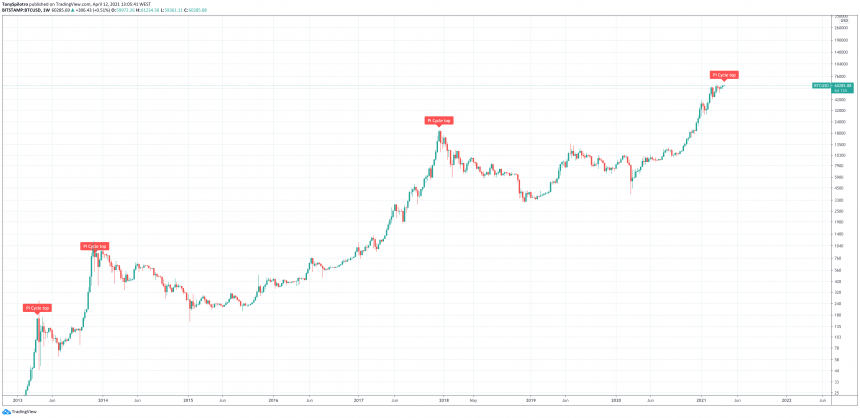
A rare crypto cycle top indicator has issued its signal. Is the rally over? | Source: BTCUSD on TradingView.com
The Pi Cycle Top Indicator has now issued the fourth ever top signal with last night’s weekly candle close and subsequent daily candle open.
That could mean that a long term top could be in. A 2013-like scenario with two peaks in the same year would be bulls last hope for things to continue, albeit after a correction.
Related Reading | Analyst Expects “Escape Velocity” When Bitcoin Price Breaks $60K. Here’s Why
Back then the signal arrived early, Bitcoin price spiked much higher, then corrected 82% within just four days. After settling down, before the year was over Bitcoin price climbed another three to four times in value before the true top of that cycle was in.
What will it be this time around?
Featured image from Deposit Photos, Charts from TradingView.com


