View
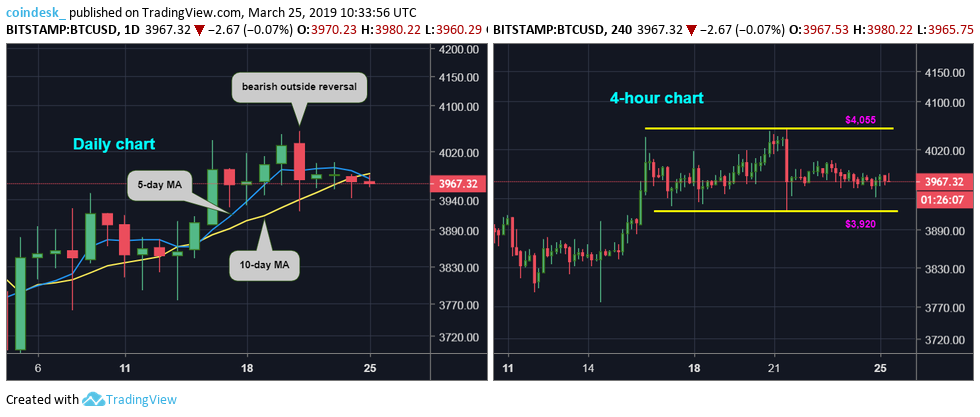
- Bitcoin’s current trading range of $3,920–$4,055 could be breached to the downside, as last week’s doji candle created at the key 21- week moving average resistance is signaling bullish exhaustion.
- A downside break of the trading range, if confirmed, could yield a sell-off toward the support levels lined up at $3,775 and $3,658.
- On the higher side, a UTC close above $4,055 is needed to put the bulls back into the driver’s seat, although that looks unlikely at press time.
Chart signals of bullish exhaustion suggest bitcoin’s (BTC) narrowing trading range could soon be breached to the downside.
The leading cryptocurrency by market value is sidelined below $4,000 for the fourth straight day, and has been restricted to the narrow range of $3,920–$4,055 since March 17, according to Bitstamp data.
More importantly, prices clocked a high and low of $4,055 and $3,920, respectively, last week before closing Sunday (UTC) largely unchanged at $3,970. The price swing formed what’s termed a doji candle on the weekly chart, which is usually taken to represent indecision in the marketplace.
The candle, however, has appeared following a 20 percent rally from lows near $3,300 seen at the end of January. So, it could be argued that the indecision, as represented by the doji, is predominantly among the buyers.
As a result, the probability of BTC ending the ongoing consolidation with a convincing break below $3,920 appears high.
As of writing, BTC is trading at $3,970 on Bitstamp, largely changed on a 24-hour basis.
Weekly chart
As seen above, BTC created a doji candle at the crucial 21-week moving average (MA) resistance, validating the bearish view put forward by that still-downward sloping momentum indicator.
The case for the downside break of the $3,920–$4,055 trading range looks stronger if we take into account the price action seen over the last five weeks.
To start with, BTC hit a high of $4,190 and created a bullish inverted hammer candle in the third week of February – a sign the market is bottoming out. That candlestick is usually followed by a quick move to the higher side.
In the last four weeks, however, BTC has failed to again challenge $4,190, weakening the bullish case.
Daily and 4-hour charts
On the daily chart, the short-term MA studies are now biased toward the bears, with the 5-day MA having dropped below the 10-day MA. Further, with the price well below the March 21 high of $4,055, the bearish outside-reversal candle created on that day is still valid.
So, the sideways channel seen in the 4-hour chart could be breached to the downside in the next day or two.
A range breakdown if confirmed would open the doors for a deeper drop toward $3,658 (Feb. 27 low).
A UTC close well above $4,055 would revive the short-term bullish view and could yield a rally toward $4,200, although gains may be short-lived, as the 21-week MA is still trending south.
Bitcoin image via Shutterstock; charts by Trading View


